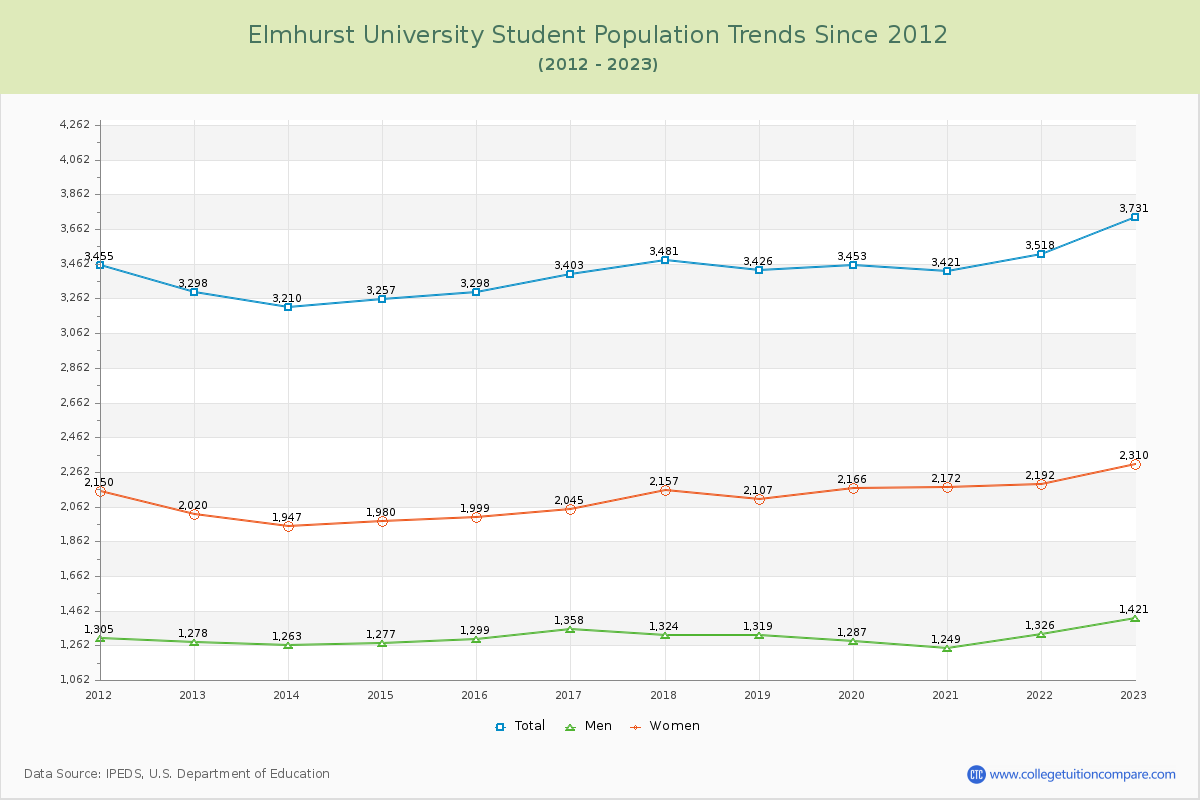
Student Population Changes
The average student population over the last 12 years is 3,409 where 3,731 students are attending the school for the academic year 2022-2023.
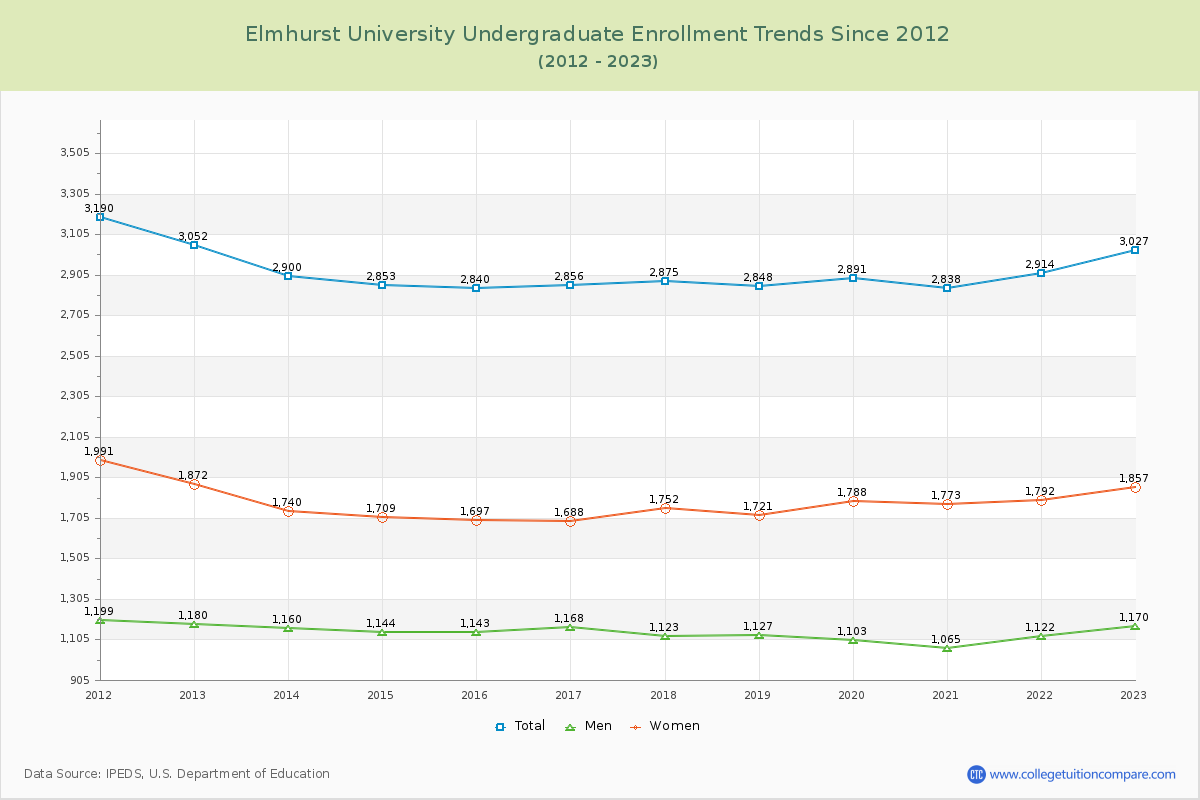
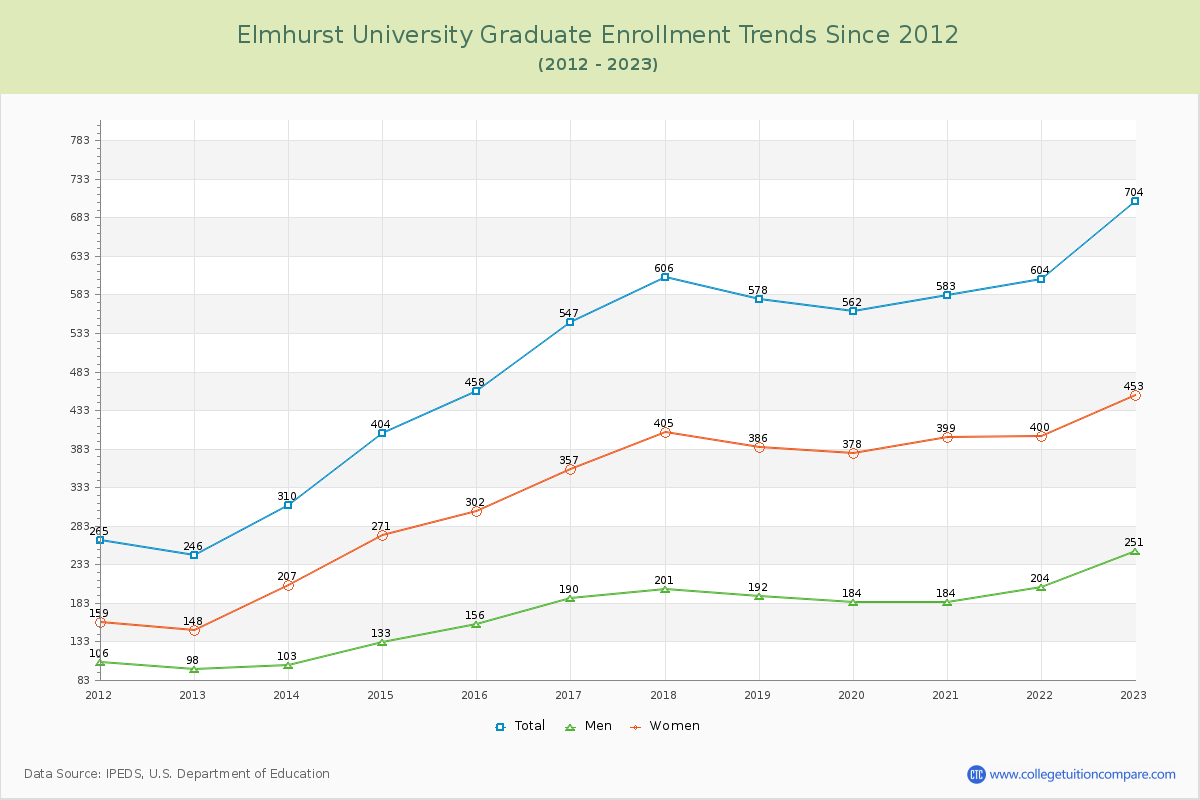
81.13% of total students is undergraduate students and 18.87% students is graduate students. The number of undergraduate students has decreased by 25 and the graduate enrollment has increased by 458 over past 10 years.
The female to male ratio is 1.63 to 1 and it means that there are more female students enrolled in Elmhurst than male students.
The following table and chart illustrate the changes in student population by gender at Elmhurst University since 2012.
| Year | Total | Undergraduate | Graduate | ||||
|---|---|---|---|---|---|---|---|
| Total | Men | Women | Total | Men | Women | ||
| 2012-13 | 3,298 | 3,052 | 1,180 | 1,872 | 246 | 98 | 148 |
| 2013-14 | 3,210 -88 | 2,900 -152 | 1,160 -20 | 1,740 -132 | 310 64 | 103 5 | 207 59 |
| 2014-15 | 3,257 47 | 2,853 -47 | 1,144 -16 | 1,709 -31 | 404 94 | 133 30 | 271 64 |
| 2015-16 | 3,298 41 | 2,840 -13 | 1,143 -1 | 1,697 -12 | 458 54 | 156 23 | 302 31 |
| 2016-17 | 3,403 105 | 2,856 16 | 1,168 25 | 1,688 -9 | 547 89 | 190 34 | 357 55 |
| 2017-18 | 3,481 78 | 2,875 19 | 1,123 -45 | 1,752 64 | 606 59 | 201 11 | 405 48 |
| 2018-19 | 3,426 -55 | 2,848 -27 | 1,127 4 | 1,721 -31 | 578 -28 | 192 -9 | 386 -19 |
| 2019-20 | 3,453 27 | 2,891 43 | 1,103 -24 | 1,788 67 | 562 -16 | 184 -8 | 378 -8 |
| 2020-21 | 3,421 -32 | 2,838 -53 | 1,065 -38 | 1,773 -15 | 583 21 | 184 0 | 399 21 |
| 2021-22 | 3,518 97 | 2,914 76 | 1,122 57 | 1,792 19 | 604 21 | 204 20 | 400 1 |
| 2022-23 | 3,731 213 | 3,027 113 | 1,170 48 | 1,857 65 | 704 100 | 251 47 | 453 53 |
| Average | 3,409 | 2,899 | 1,137 | 1,763 | 509 | 172 | 337 |