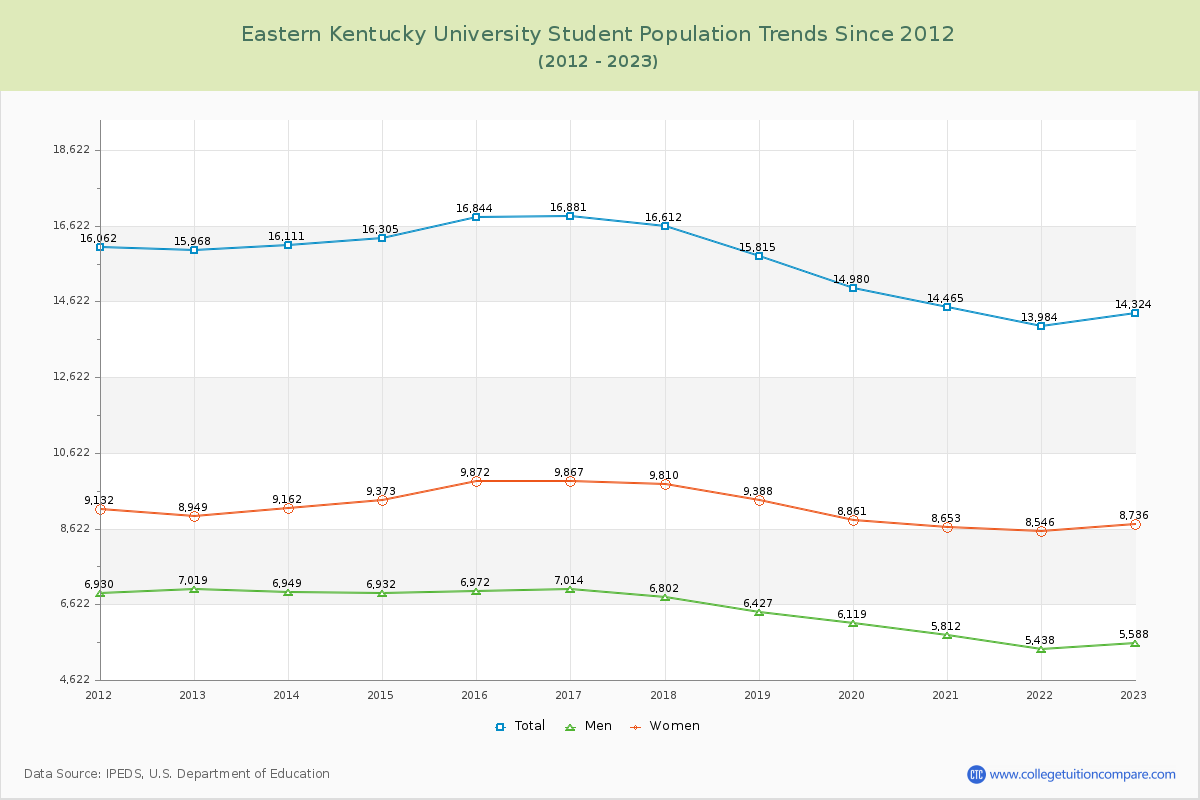
Student Population Changes
The average student population over the last 12 years is 15,663 where 14,324 students are attending the school for the academic year 2022-2023.
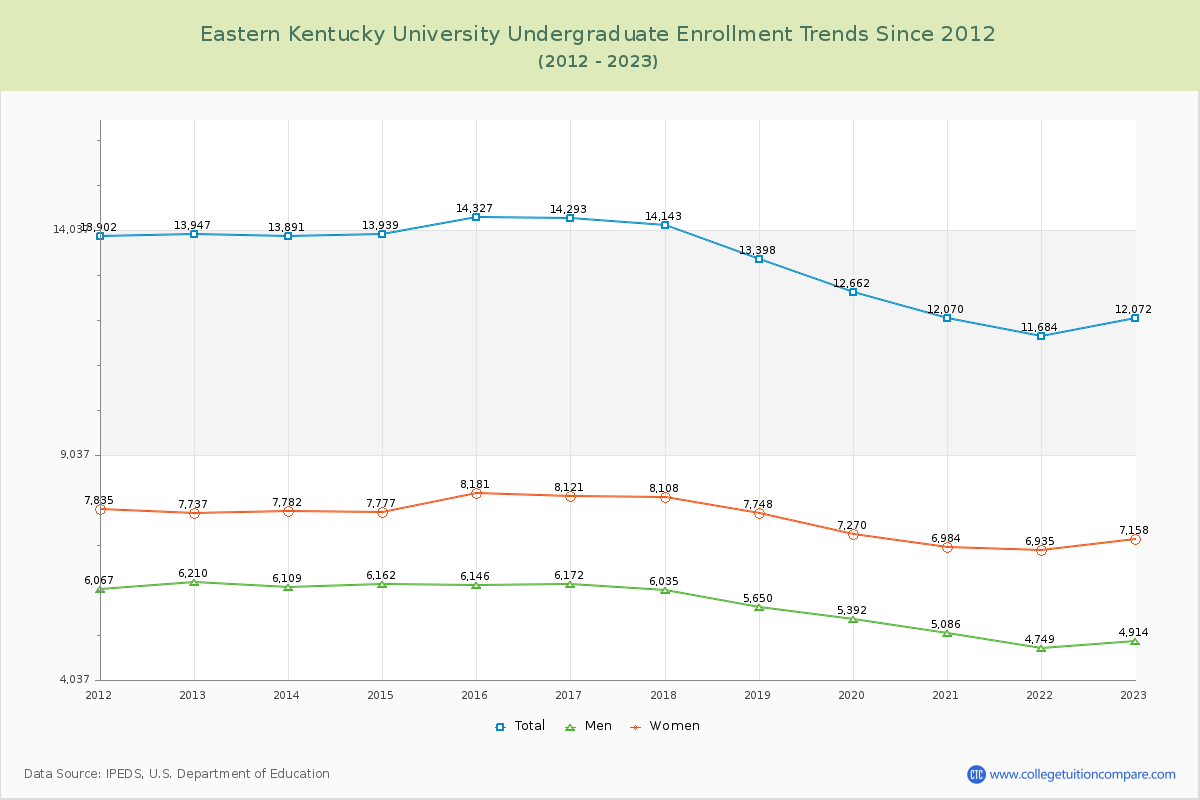
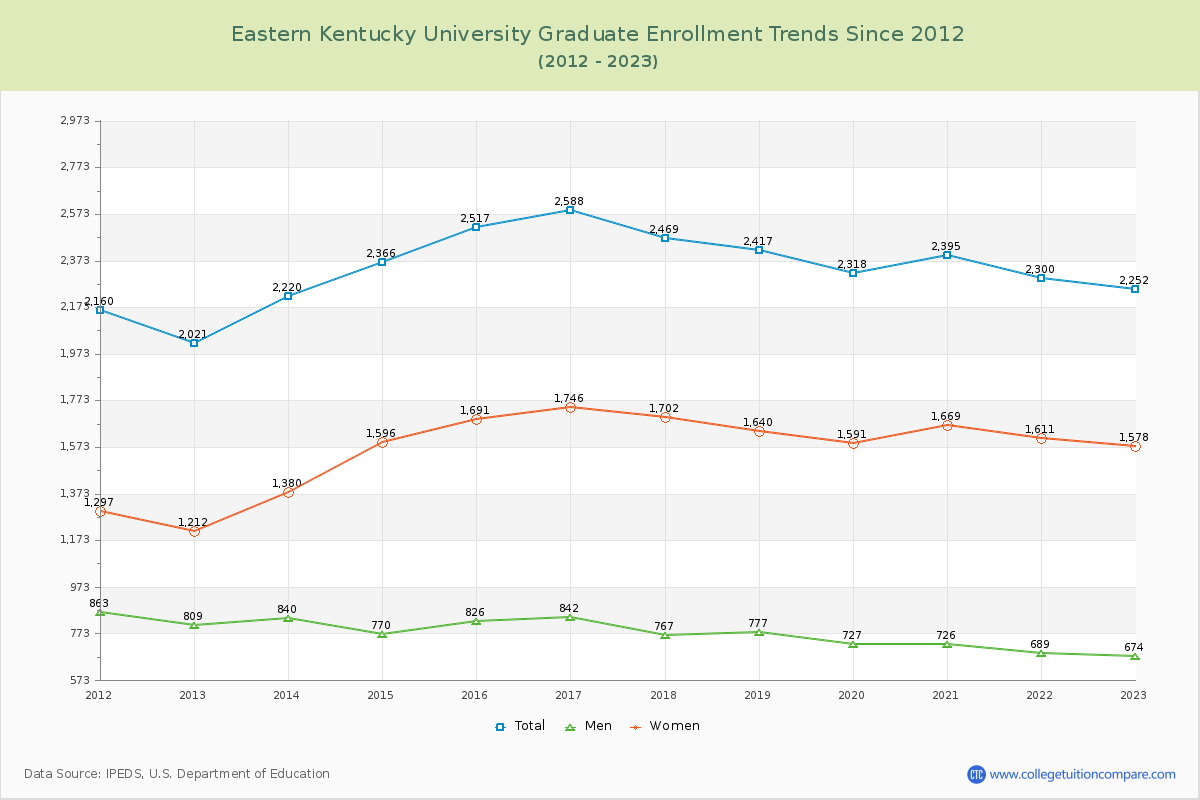
84.28% of total students is undergraduate students and 15.72% students is graduate students. The number of undergraduate students has decreased by 1,875 and the graduate enrollment has increased by 231 over past 10 years.
The female to male ratio is 1.56 to 1 and it means that there are more female students enrolled in EKU than male students.
The following table and chart illustrate the changes in student population by gender at Eastern Kentucky University since 2012.
| Year | Total | Undergraduate | Graduate | ||||
|---|---|---|---|---|---|---|---|
| Total | Men | Women | Total | Men | Women | ||
| 2012-13 | 15,968 | 13,947 | 6,210 | 7,737 | 2,021 | 809 | 1,212 |
| 2013-14 | 16,111 143 | 13,891 -56 | 6,109 -101 | 7,782 45 | 2,220 199 | 840 31 | 1,380 168 |
| 2014-15 | 16,305 194 | 13,939 48 | 6,162 53 | 7,777 -5 | 2,366 146 | 770 -70 | 1,596 216 |
| 2015-16 | 16,844 539 | 14,327 388 | 6,146 -16 | 8,181 404 | 2,517 151 | 826 56 | 1,691 95 |
| 2016-17 | 16,881 37 | 14,293 -34 | 6,172 26 | 8,121 -60 | 2,588 71 | 842 16 | 1,746 55 |
| 2017-18 | 16,612 -269 | 14,143 -150 | 6,035 -137 | 8,108 -13 | 2,469 -119 | 767 -75 | 1,702 -44 |
| 2018-19 | 15,815 -797 | 13,398 -745 | 5,650 -385 | 7,748 -360 | 2,417 -52 | 777 10 | 1,640 -62 |
| 2019-20 | 14,980 -835 | 12,662 -736 | 5,392 -258 | 7,270 -478 | 2,318 -99 | 727 -50 | 1,591 -49 |
| 2020-21 | 14,465 -515 | 12,070 -592 | 5,086 -306 | 6,984 -286 | 2,395 77 | 726 -1 | 1,669 78 |
| 2021-22 | 13,984 -481 | 11,684 -386 | 4,749 -337 | 6,935 -49 | 2,300 -95 | 689 -37 | 1,611 -58 |
| 2022-23 | 14,324 340 | 12,072 388 | 4,914 165 | 7,158 223 | 2,252 -48 | 674 -15 | 1,578 -33 |
| Average | 15,663 | 13,311 | 5,693 | 7,618 | 2,351 | 768 | 1,583 |