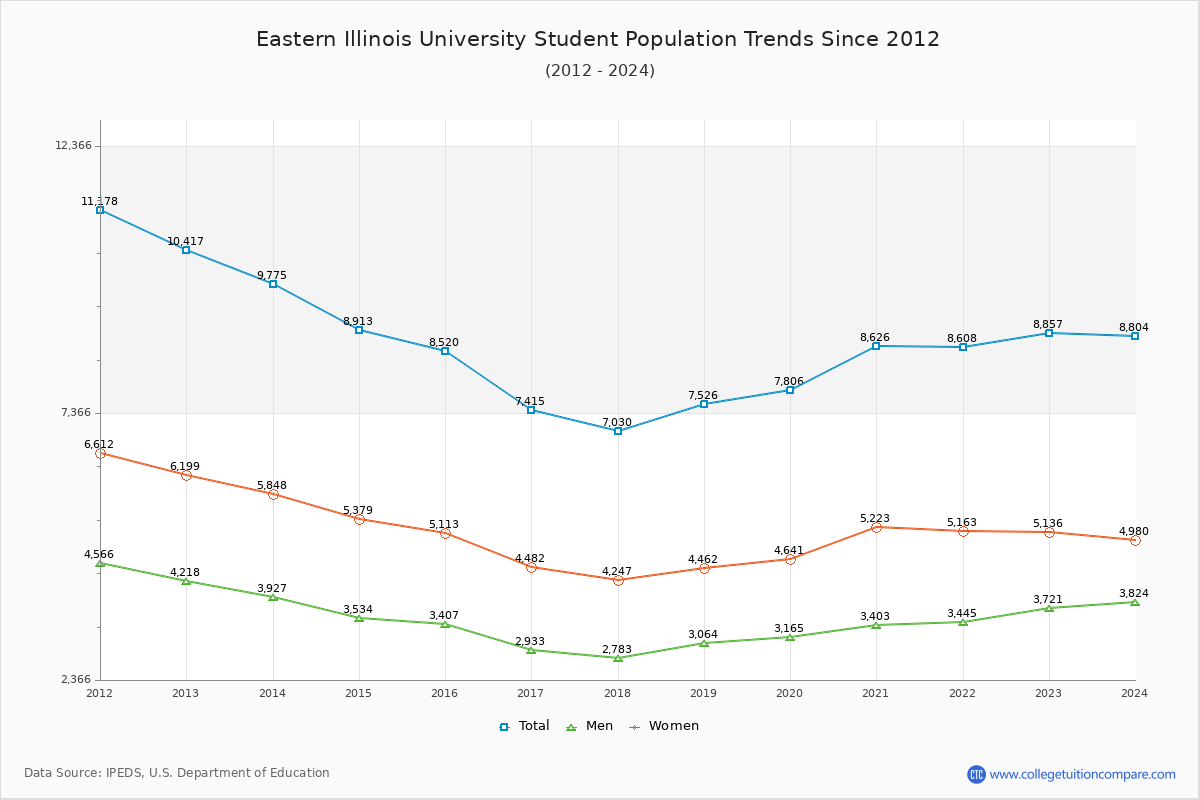
Student Population Changes
The average student population over the last 12 years is 8,499 where 8,857 students are attending the school for the academic year 2022-2023.
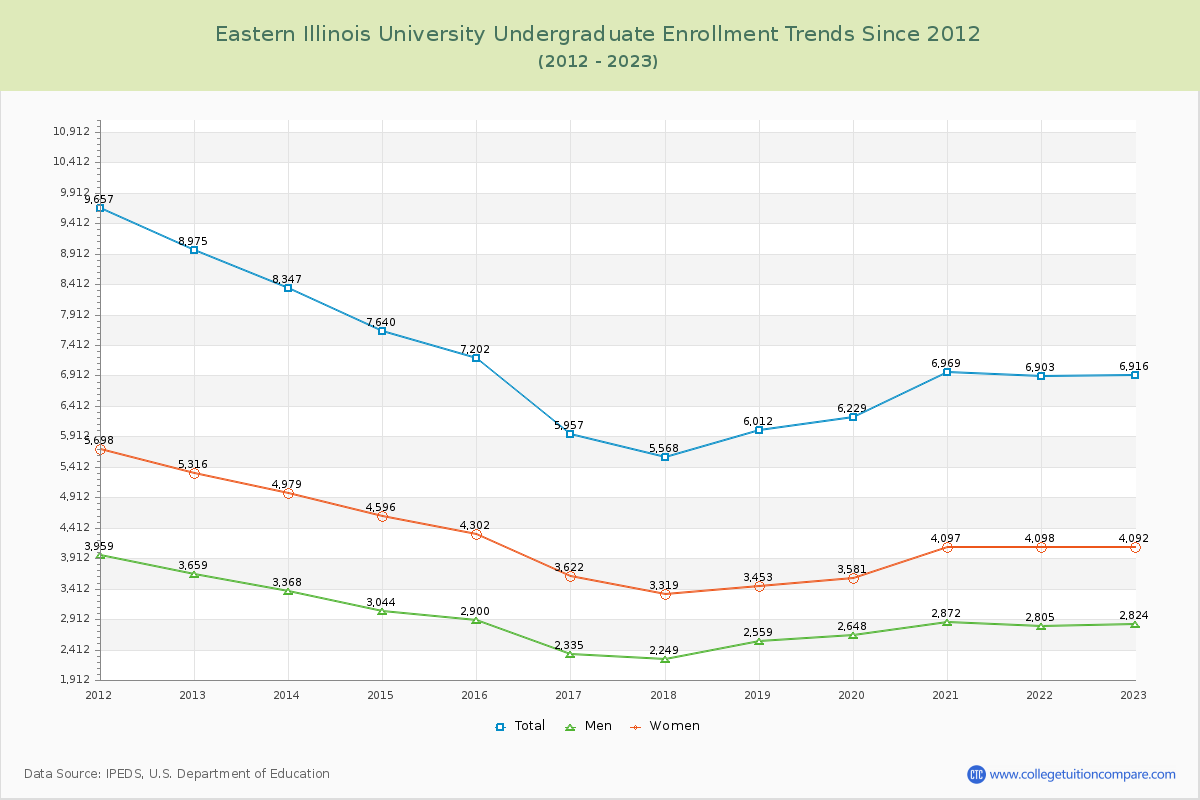
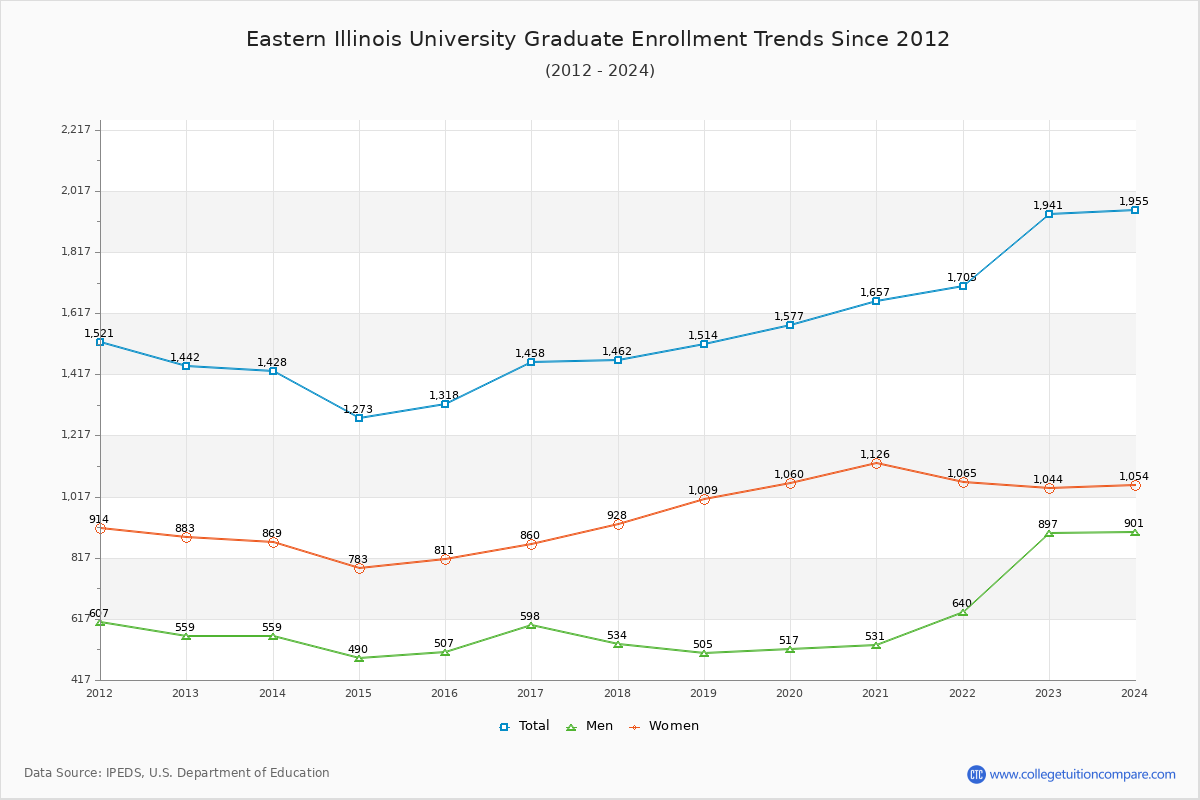
78.09% of total students is undergraduate students and 21.91% students is graduate students. The number of undergraduate students has decreased by 2,059 and the graduate enrollment has increased by 499 over past 10 years.
The female to male ratio is 1.38 to 1 and it means that there are more female students enrolled in EIU than male students.
The following table and chart illustrate the changes in student population by gender at Eastern Illinois University since 2012.
| Year | Total | Undergraduate | Graduate | ||||
|---|---|---|---|---|---|---|---|
| Total | Men | Women | Total | Men | Women | ||
| 2012-13 | 10,417 | 8,975 | 3,659 | 5,316 | 1,442 | 559 | 883 |
| 2013-14 | 9,775 -642 | 8,347 -628 | 3,368 -291 | 4,979 -337 | 1,428 -14 | 559 0 | 869 -14 |
| 2014-15 | 8,913 -862 | 7,640 -707 | 3,044 -324 | 4,596 -383 | 1,273 -155 | 490 -69 | 783 -86 |
| 2015-16 | 8,520 -393 | 7,202 -438 | 2,900 -144 | 4,302 -294 | 1,318 45 | 507 17 | 811 28 |
| 2016-17 | 7,415 -1,105 | 5,957 -1,245 | 2,335 -565 | 3,622 -680 | 1,458 140 | 598 91 | 860 49 |
| 2017-18 | 7,030 -385 | 5,568 -389 | 2,249 -86 | 3,319 -303 | 1,462 4 | 534 -64 | 928 68 |
| 2018-19 | 7,526 496 | 6,012 444 | 2,559 310 | 3,453 134 | 1,514 52 | 505 -29 | 1,009 81 |
| 2019-20 | 7,806 280 | 6,229 217 | 2,648 89 | 3,581 128 | 1,577 63 | 517 12 | 1,060 51 |
| 2020-21 | 8,626 820 | 6,969 740 | 2,872 224 | 4,097 516 | 1,657 80 | 531 14 | 1,126 66 |
| 2021-22 | 8,608 -18 | 6,903 -66 | 2,805 -67 | 4,098 1 | 1,705 48 | 640 109 | 1,065 -61 |
| 2022-23 | 8,857 249 | 6,916 13 | 2,824 19 | 4,092 -6 | 1,941 236 | 897 257 | 1,044 -21 |
| Average | 8,499 | 6,974 | 2,842 | 4,132 | 1,525 | 576 | 949 |