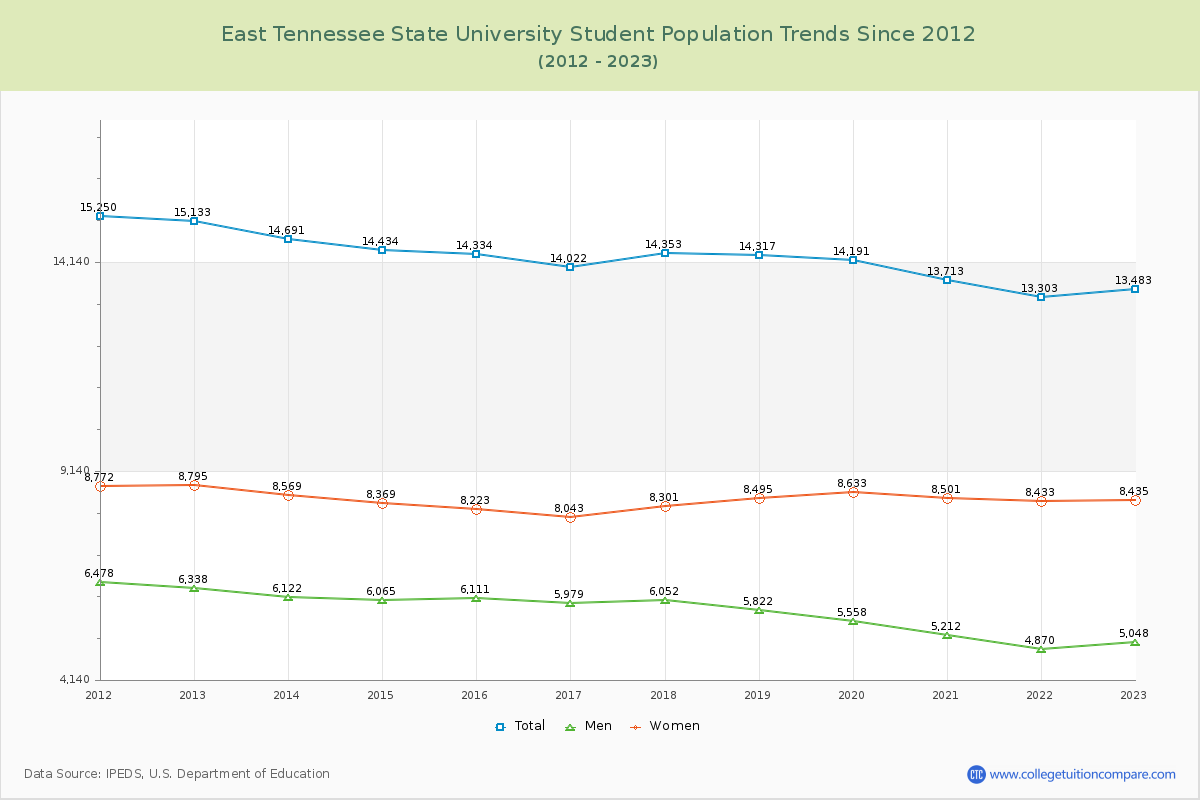
Student Population Changes
The average student population over the last 12 years is 14,179 where 13,483 students are attending the school for the academic year 2022-2023.
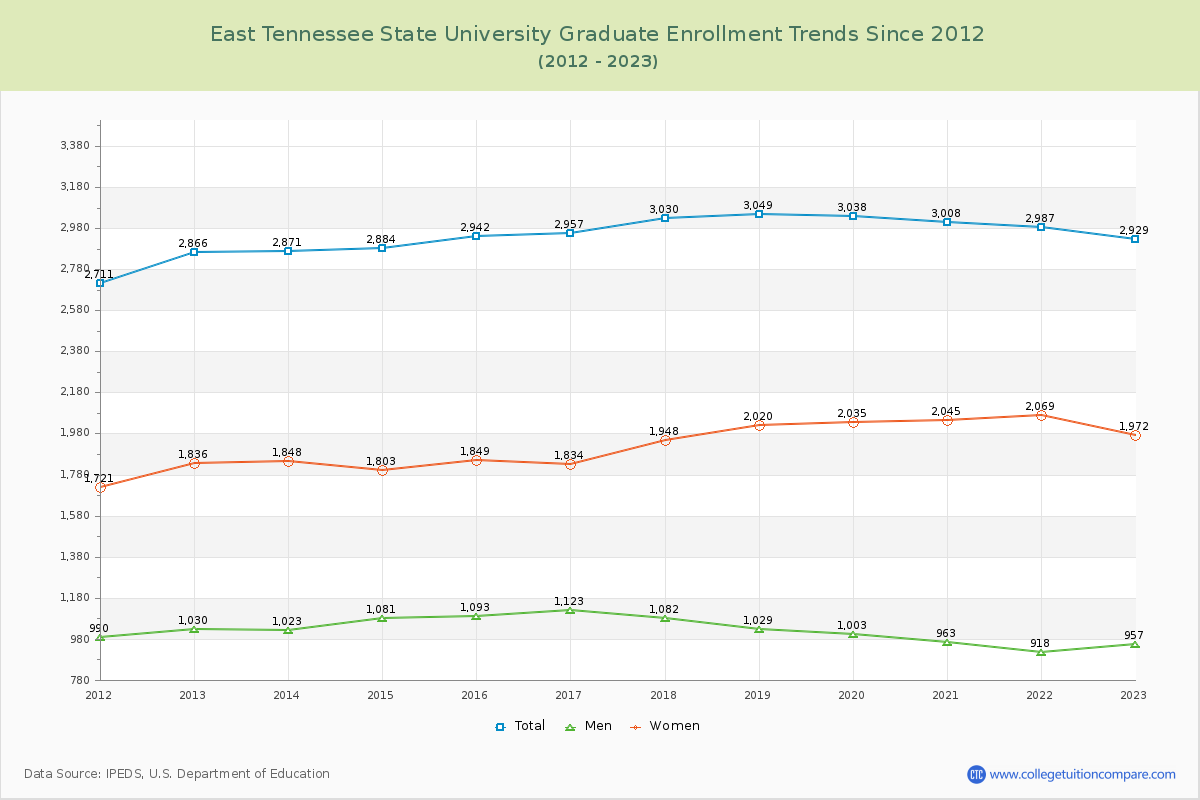
78.28% of total students is undergraduate students and 21.72% students is graduate students. The number of undergraduate students has decreased by 1,713 and the graduate enrollment has increased by 63 over past 10 years.
The female to male ratio is 1.67 to 1 and it means that there are more female students enrolled in ETSU than male students.
The following table and chart illustrate the changes in student population by gender at East Tennessee State University since 2012.
| Year | Total | Undergraduate | Graduate | ||||
|---|---|---|---|---|---|---|---|
| Total | Men | Women | Total | Men | Women | ||
| 2012-13 | 15,133 | 12,267 | 5,308 | 6,959 | 2,866 | 1,030 | 1,836 |
| 2013-14 | 14,691 -442 | 11,820 -447 | 5,099 -209 | 6,721 -238 | 2,871 5 | 1,023 -7 | 1,848 12 |
| 2014-15 | 14,434 -257 | 11,550 -270 | 4,984 -115 | 6,566 -155 | 2,884 13 | 1,081 58 | 1,803 -45 |
| 2015-16 | 14,334 -100 | 11,392 -158 | 5,018 34 | 6,374 -192 | 2,942 58 | 1,093 12 | 1,849 46 |
| 2016-17 | 14,022 -312 | 11,065 -327 | 4,856 -162 | 6,209 -165 | 2,957 15 | 1,123 30 | 1,834 -15 |
| 2017-18 | 14,353 331 | 11,323 258 | 4,970 114 | 6,353 144 | 3,030 73 | 1,082 -41 | 1,948 114 |
| 2018-19 | 14,317 -36 | 11,268 -55 | 4,793 -177 | 6,475 122 | 3,049 19 | 1,029 -53 | 2,020 72 |
| 2019-20 | 14,191 -126 | 11,153 -115 | 4,555 -238 | 6,598 123 | 3,038 -11 | 1,003 -26 | 2,035 15 |
| 2020-21 | 13,713 -478 | 10,705 -448 | 4,249 -306 | 6,456 -142 | 3,008 -30 | 963 -40 | 2,045 10 |
| 2021-22 | 13,303 -410 | 10,316 -389 | 3,952 -297 | 6,364 -92 | 2,987 -21 | 918 -45 | 2,069 24 |
| 2022-23 | 13,483 180 | 10,554 238 | 4,091 139 | 6,463 99 | 2,929 -58 | 957 39 | 1,972 -97 |
| Average | 14,179 | 11,219 | 4,716 | 6,503 | 2,960 | 1,027 | 1,933 |