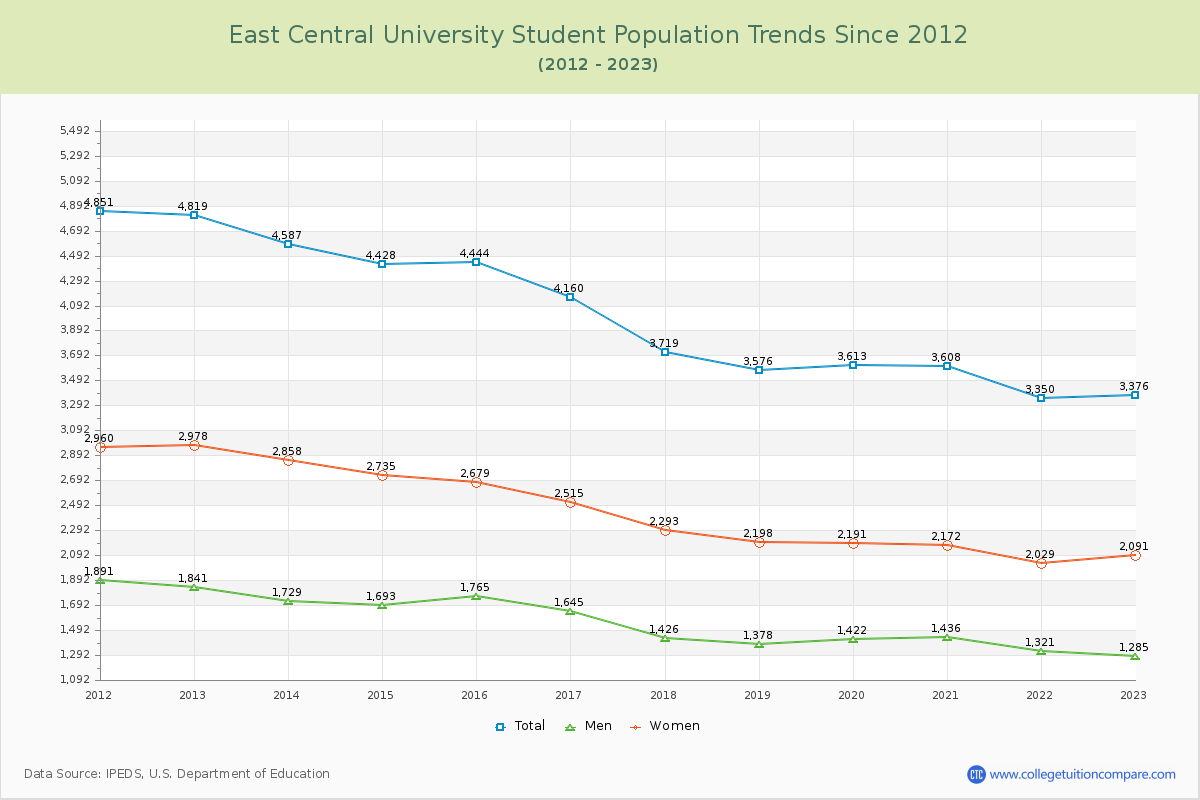
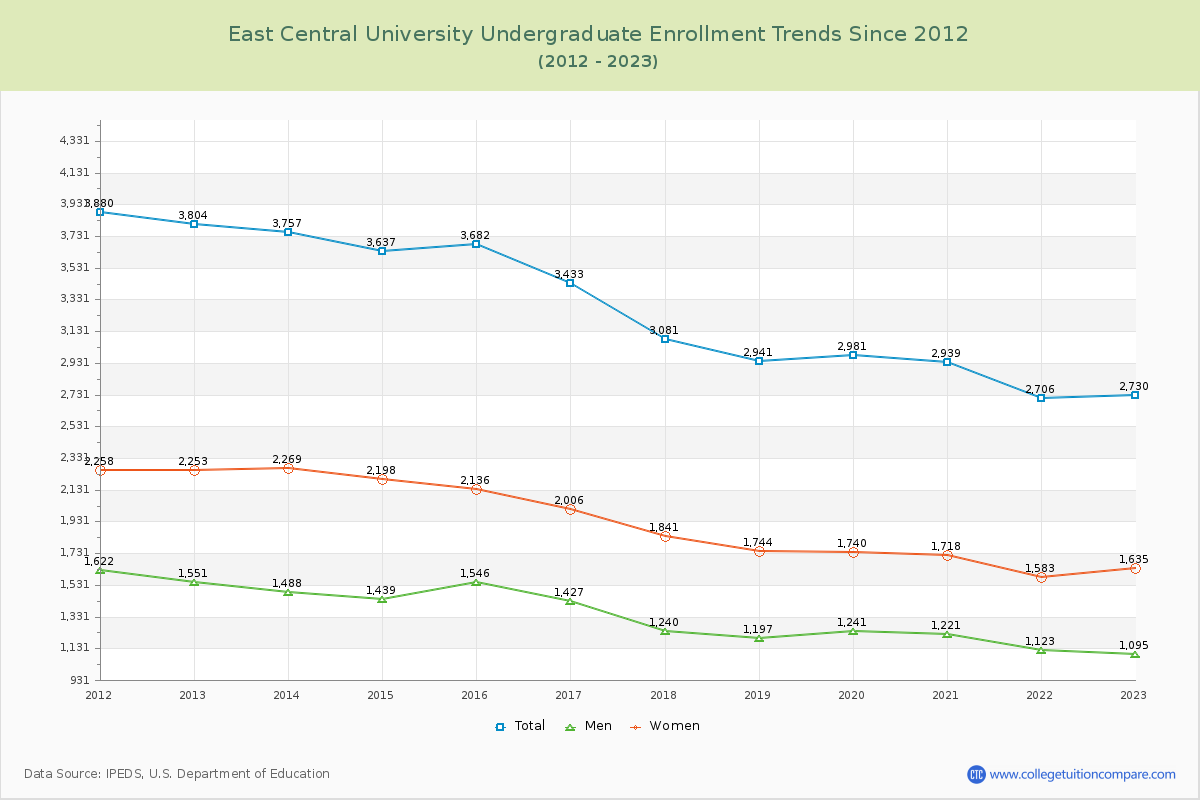
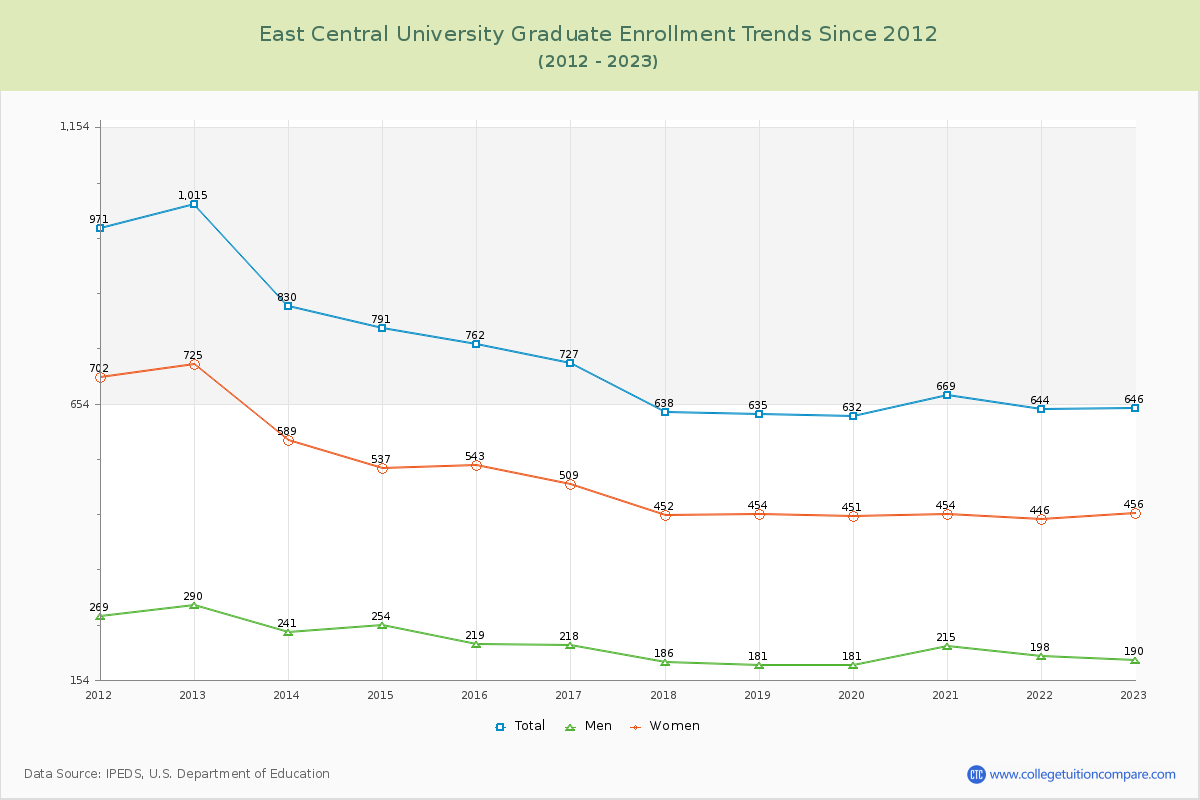
Student Population Changes
The average student population over the last 12 years is 3,971 where 3,376 students are attending the school for the academic year 2022-2023.
80.86% of total students is undergraduate students and 19.14% students is graduate students. The number of undergraduate students has decreased by 1,074 and the graduate enrollment has decreased by 369 over past 10 years.
The female to male ratio is 1.63 to 1 and it means that there are more female students enrolled in ECU than male students.
The following table and chart illustrate the changes in student population by gender at East Central University since 2012.
| Year | Total | Undergraduate | Graduate | ||||
|---|---|---|---|---|---|---|---|
| Total | Men | Women | Total | Men | Women | ||
| 2012-13 | 4,819 | 3,804 | 1,551 | 2,253 | 1,015 | 290 | 725 |
| 2013-14 | 4,587 -232 | 3,757 -47 | 1,488 -63 | 2,269 16 | 830 -185 | 241 -49 | 589 -136 |
| 2014-15 | 4,428 -159 | 3,637 -120 | 1,439 -49 | 2,198 -71 | 791 -39 | 254 13 | 537 -52 |
| 2015-16 | 4,444 16 | 3,682 45 | 1,546 107 | 2,136 -62 | 762 -29 | 219 -35 | 543 6 |
| 2016-17 | 4,160 -284 | 3,433 -249 | 1,427 -119 | 2,006 -130 | 727 -35 | 218 -1 | 509 -34 |
| 2017-18 | 3,719 -441 | 3,081 -352 | 1,240 -187 | 1,841 -165 | 638 -89 | 186 -32 | 452 -57 |
| 2018-19 | 3,576 -143 | 2,941 -140 | 1,197 -43 | 1,744 -97 | 635 -3 | 181 -5 | 454 2 |
| 2019-20 | 3,613 37 | 2,981 40 | 1,241 44 | 1,740 -4 | 632 -3 | 181 0 | 451 -3 |
| 2020-21 | 3,608 -5 | 2,939 -42 | 1,221 -20 | 1,718 -22 | 669 37 | 215 34 | 454 3 |
| 2021-22 | 3,350 -258 | 2,706 -233 | 1,123 -98 | 1,583 -135 | 644 -25 | 198 -17 | 446 -8 |
| 2022-23 | 3,376 26 | 2,730 24 | 1,095 -28 | 1,635 52 | 646 2 | 190 -8 | 456 10 |
| Average | 3,971 | 3,245 | 1,324 | 1,920 | 726 | 216 | 511 |