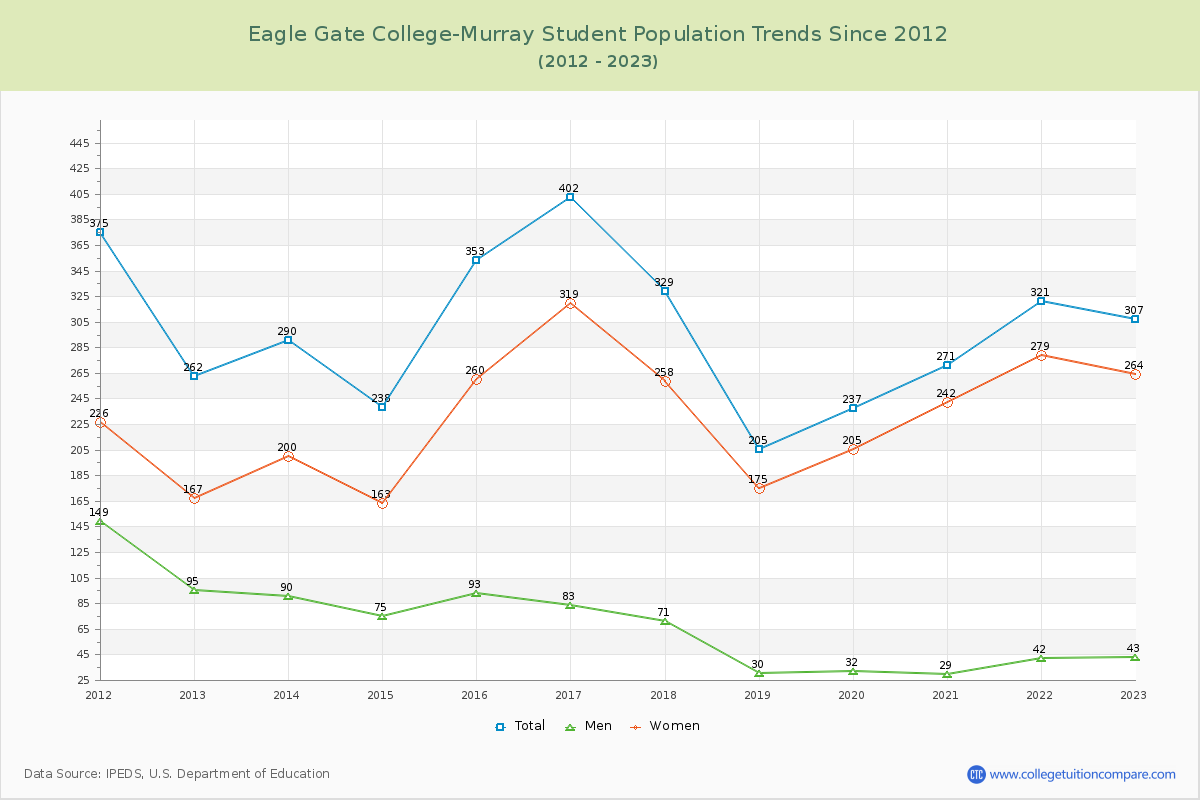
Student Population Changes
The average student population over the last 12 years is 292 where 307 students are attending the school for the academic year 2022-2023.
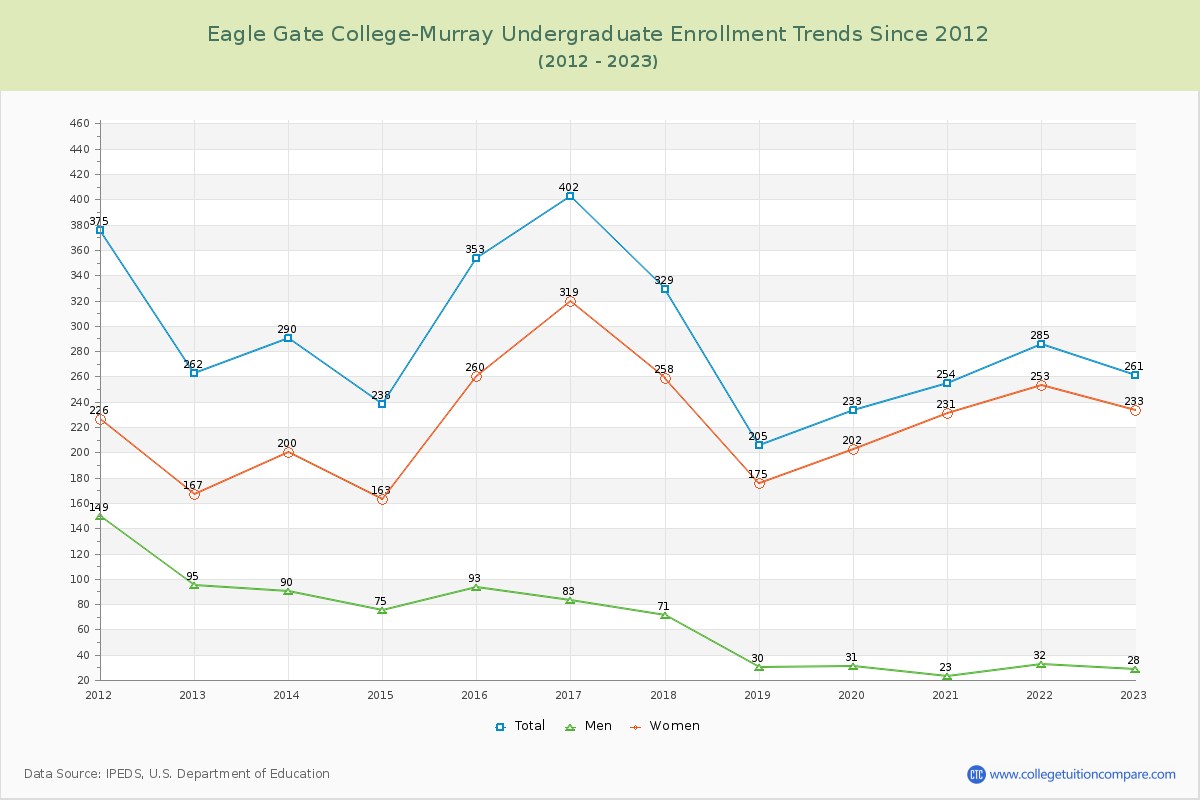
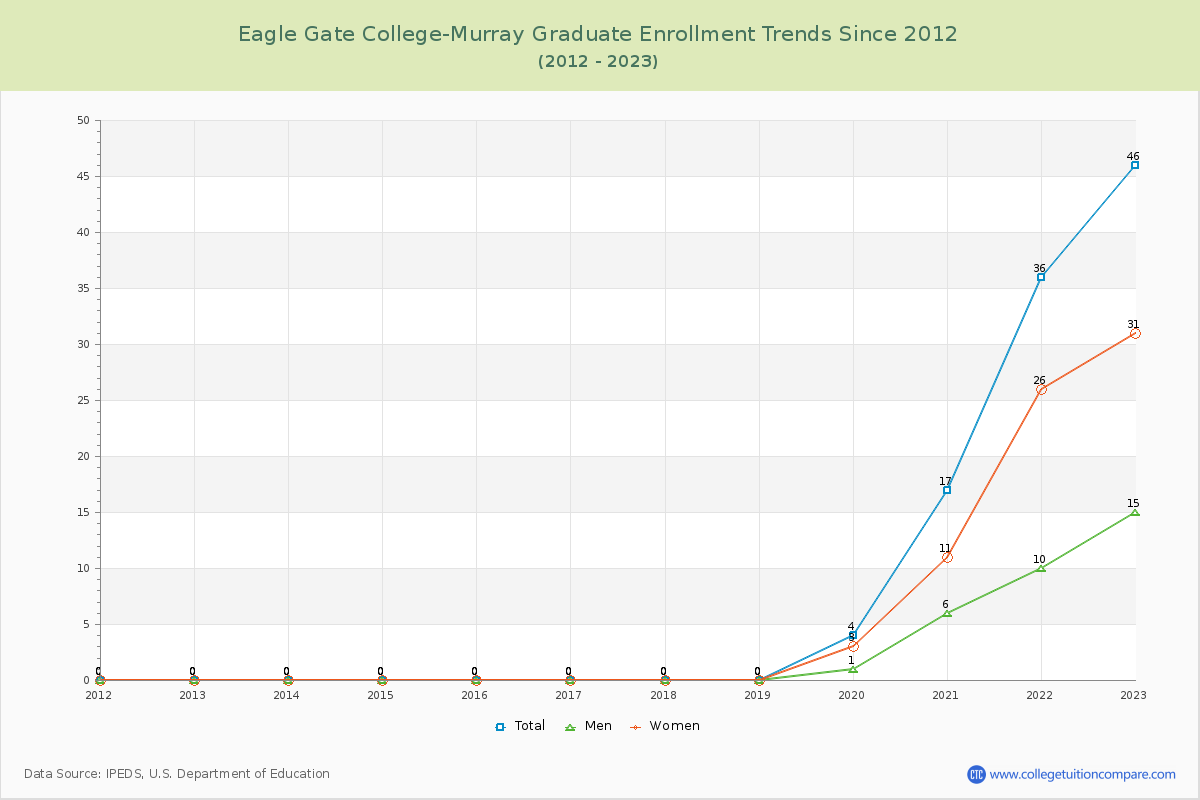
85.02% of total students is undergraduate students and 14.98% students is graduate students. The number of undergraduate students has decreased by 1 and the graduate enrollment has increased by 46 over past 10 years.
The female to male ratio is 6.14 to 1 and it means that there are far more female students enrolled in Eagle Gate College-Murray than male students.
The following table and chart illustrate the changes in student population by gender at Eagle Gate College-Murray since 2012.
| Year | Total | Undergraduate | Graduate | ||||
|---|---|---|---|---|---|---|---|
| Total | Men | Women | Total | Men | Women | ||
| 2012-13 | 262 | 262 | 95 | 167 | 0 | 0 | 0 |
| 2013-14 | 290 28 | 290 28 | 90 -5 | 200 33 | 0 0 | 0 0 | 0 0 |
| 2014-15 | 238 -52 | 238 -52 | 75 -15 | 163 -37 | 0 0 | 0 0 | 0 0 |
| 2015-16 | 353 115 | 353 115 | 93 18 | 260 97 | 0 0 | 0 0 | 0 0 |
| 2016-17 | 402 49 | 402 49 | 83 -10 | 319 59 | 0 0 | 0 0 | 0 0 |
| 2017-18 | 329 -73 | 329 -73 | 71 -12 | 258 -61 | 0 0 | 0 0 | 0 0 |
| 2018-19 | 205 -124 | 205 -124 | 30 -41 | 175 -83 | 0 0 | 0 0 | 0 0 |
| 2019-20 | 237 32 | 233 28 | 31 1 | 202 27 | 4 4 | 1 1 | 3 3 |
| 2020-21 | 271 34 | 254 21 | 23 -8 | 231 29 | 17 13 | 6 5 | 11 8 |
| 2021-22 | 321 50 | 285 31 | 32 9 | 253 22 | 36 19 | 10 4 | 26 15 |
| 2022-23 | 307 -14 | 261 -24 | 28 -4 | 233 -20 | 46 10 | 15 5 | 31 5 |
| Average | 292 | 283 | 59 | 224 | 9 | 3 | 6 |