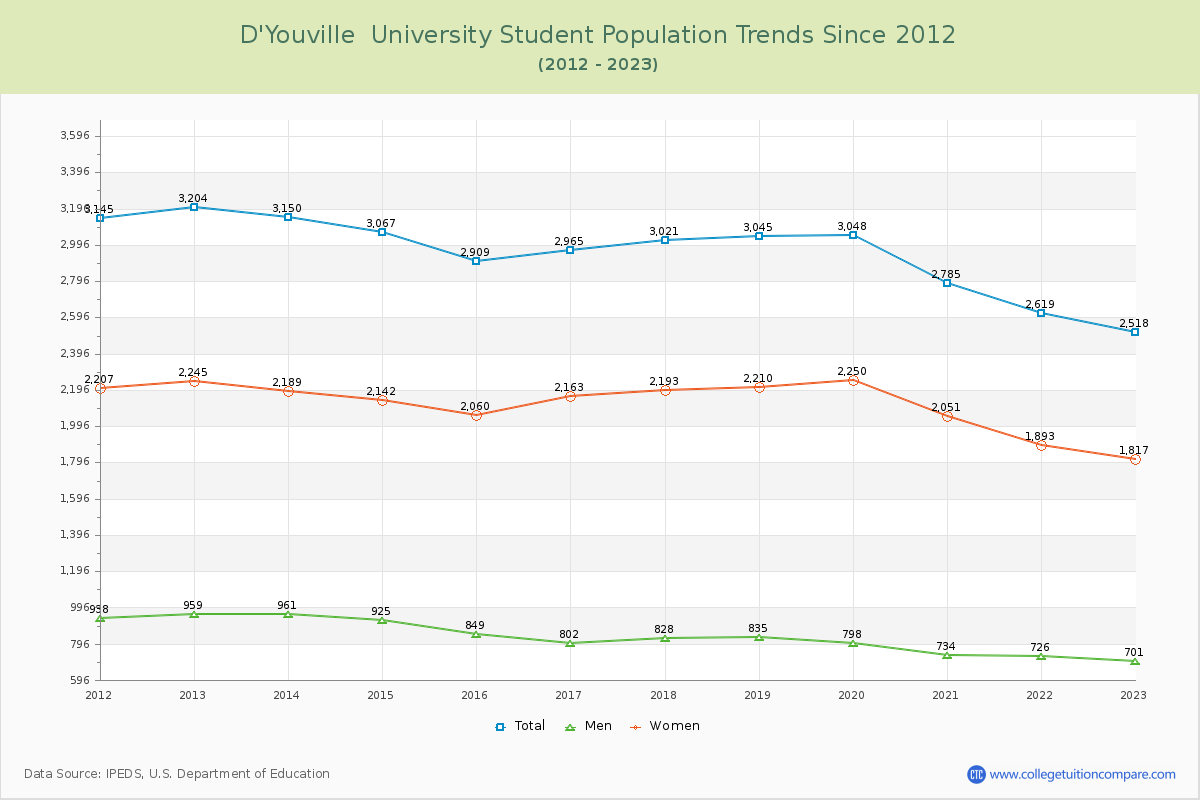
Student Population Changes
The average student population over the last 12 years is 2,939 where 2,518 students are attending the school for the academic year 2022-2023.
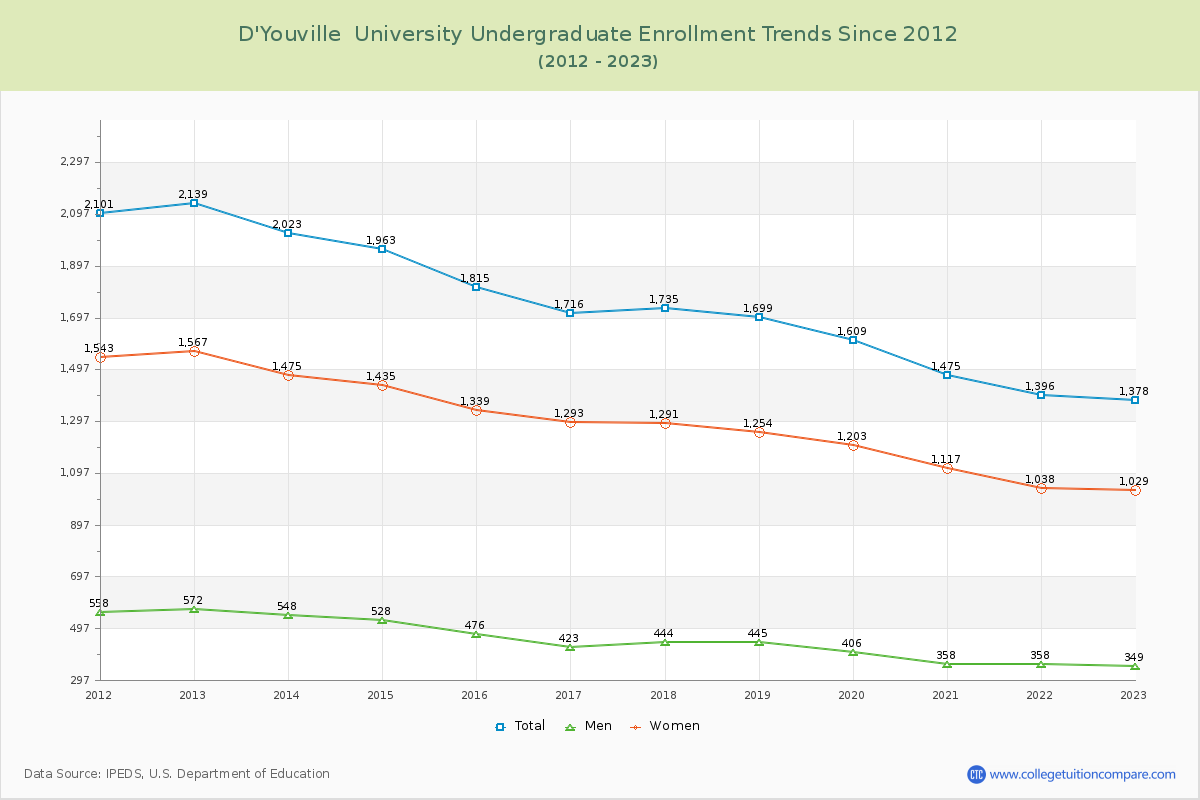
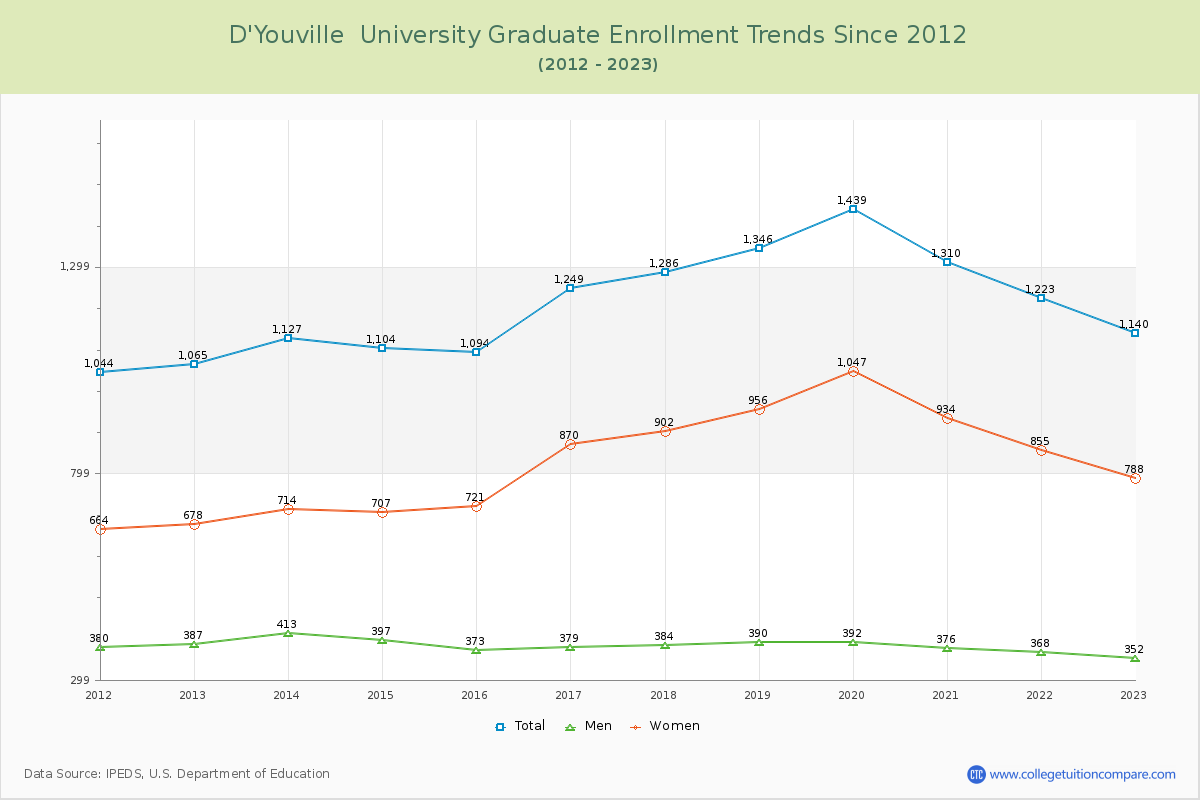
54.73% of total students is undergraduate students and 45.27% students is graduate students. The number of undergraduate students has decreased by 761 and the graduate enrollment has increased by 75 over past 10 years.
The female to male ratio is 2.59 to 1 and it means that there are far more female students enrolled in D'Youville than male students.
The following table and chart illustrate the changes in student population by gender at D'Youville University since 2012.
| Year | Total | Undergraduate | Graduate | ||||
|---|---|---|---|---|---|---|---|
| Total | Men | Women | Total | Men | Women | ||
| 2012-13 | 3,204 | 2,139 | 572 | 1,567 | 1,065 | 387 | 678 |
| 2013-14 | 3,150 -54 | 2,023 -116 | 548 -24 | 1,475 -92 | 1,127 62 | 413 26 | 714 36 |
| 2014-15 | 3,067 -83 | 1,963 -60 | 528 -20 | 1,435 -40 | 1,104 -23 | 397 -16 | 707 -7 |
| 2015-16 | 2,909 -158 | 1,815 -148 | 476 -52 | 1,339 -96 | 1,094 -10 | 373 -24 | 721 14 |
| 2016-17 | 2,965 56 | 1,716 -99 | 423 -53 | 1,293 -46 | 1,249 155 | 379 6 | 870 149 |
| 2017-18 | 3,021 56 | 1,735 19 | 444 21 | 1,291 -2 | 1,286 37 | 384 5 | 902 32 |
| 2018-19 | 3,045 24 | 1,699 -36 | 445 1 | 1,254 -37 | 1,346 60 | 390 6 | 956 54 |
| 2019-20 | 3,048 3 | 1,609 -90 | 406 -39 | 1,203 -51 | 1,439 93 | 392 2 | 1,047 91 |
| 2020-21 | 2,785 -263 | 1,475 -134 | 358 -48 | 1,117 -86 | 1,310 -129 | 376 -16 | 934 -113 |
| 2021-22 | 2,619 -166 | 1,396 -79 | 358 0 | 1,038 -79 | 1,223 -87 | 368 -8 | 855 -79 |
| 2022-23 | 2,518 -101 | 1,378 -18 | 349 -9 | 1,029 -9 | 1,140 -83 | 352 -16 | 788 -67 |
| Average | 2,939 | 1,723 | 446 | 1,276 | 1,217 | 383 | 834 |