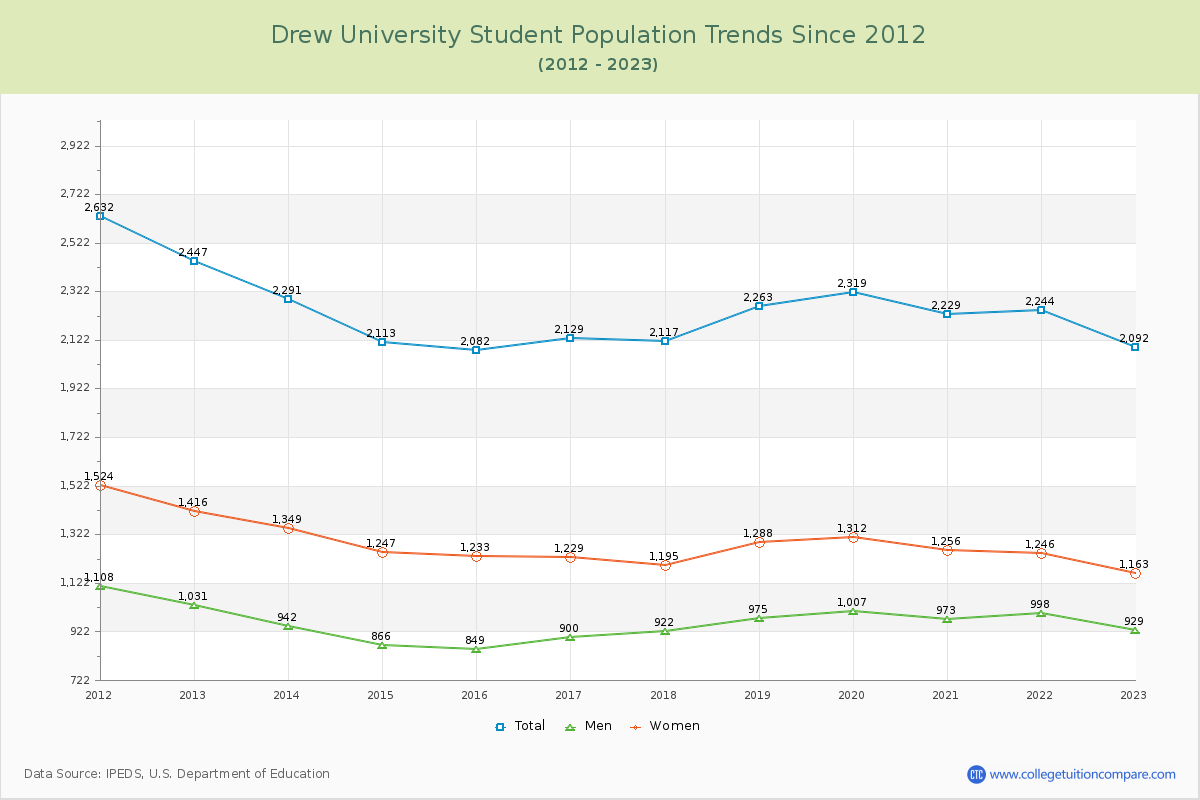
Student Population Changes
The average student population over the last 12 years is 2,211 where 2,092 students are attending the school for the academic year 2022-2023.
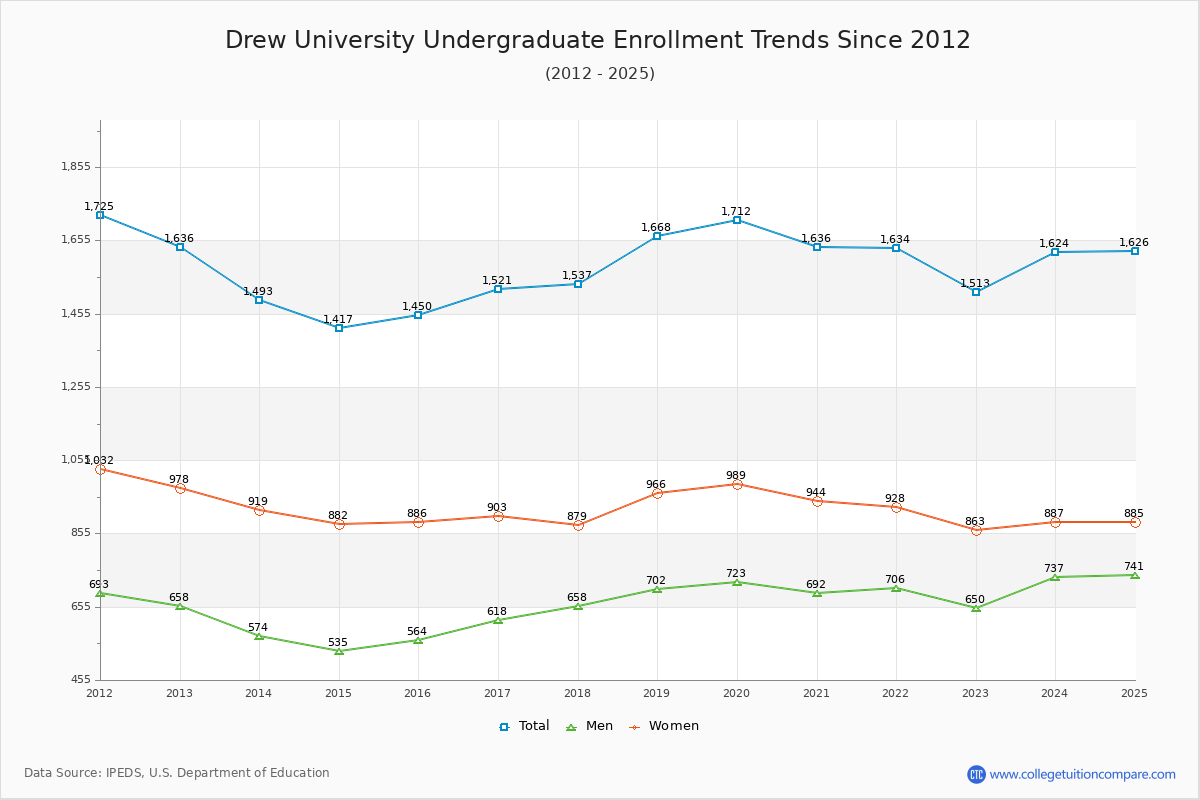
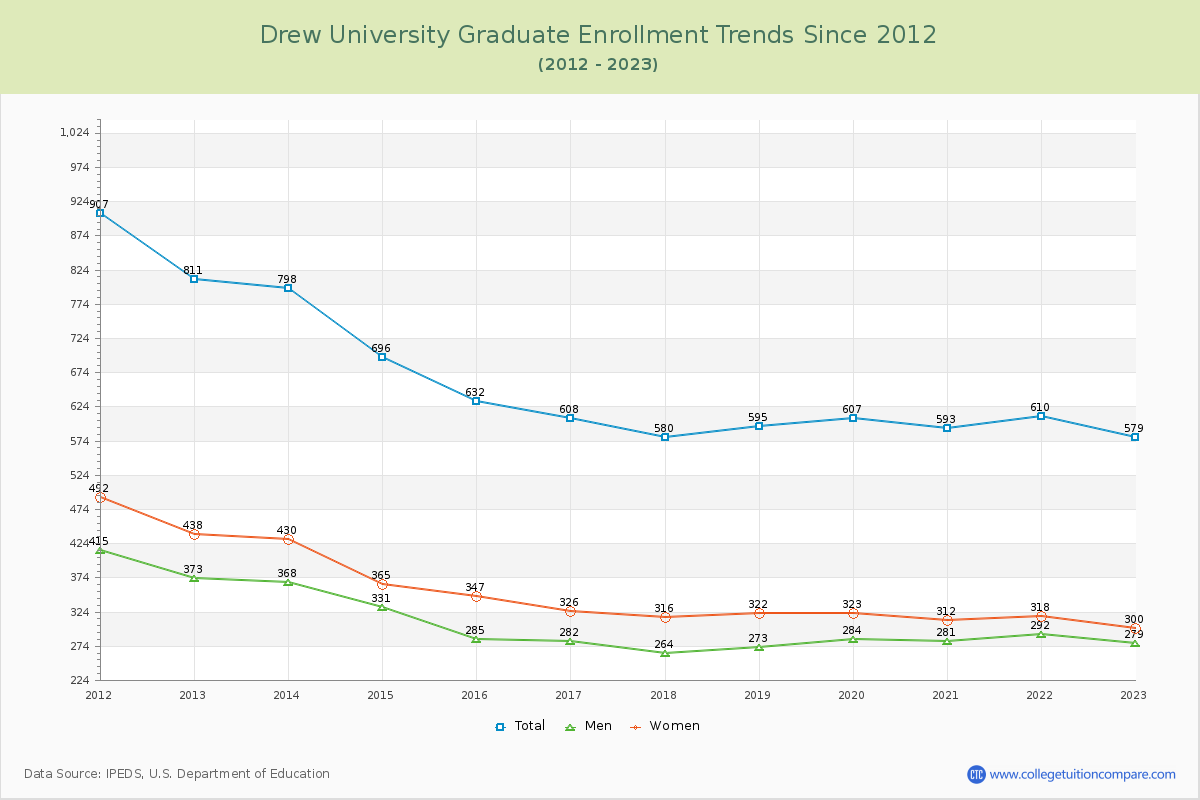
72.32% of total students is undergraduate students and 27.68% students is graduate students. The number of undergraduate students has decreased by 123 and the graduate enrollment has decreased by 232 over past 10 years.
The female to male ratio is 1.25 to 1 and it means that there are slightly more female students enrolled in Drew than male students.
The following table and chart illustrate the changes in student population by gender at Drew University since 2012.
| Year | Total | Undergraduate | Graduate | ||||
|---|---|---|---|---|---|---|---|
| Total | Men | Women | Total | Men | Women | ||
| 2012-13 | 2,447 | 1,636 | 658 | 978 | 811 | 373 | 438 |
| 2013-14 | 2,291 -156 | 1,493 -143 | 574 -84 | 919 -59 | 798 -13 | 368 -5 | 430 -8 |
| 2014-15 | 2,113 -178 | 1,417 -76 | 535 -39 | 882 -37 | 696 -102 | 331 -37 | 365 -65 |
| 2015-16 | 2,082 -31 | 1,450 33 | 564 29 | 886 4 | 632 -64 | 285 -46 | 347 -18 |
| 2016-17 | 2,129 47 | 1,521 71 | 618 54 | 903 17 | 608 -24 | 282 -3 | 326 -21 |
| 2017-18 | 2,117 -12 | 1,537 16 | 658 40 | 879 -24 | 580 -28 | 264 -18 | 316 -10 |
| 2018-19 | 2,263 146 | 1,668 131 | 702 44 | 966 87 | 595 15 | 273 9 | 322 6 |
| 2019-20 | 2,319 56 | 1,712 44 | 723 21 | 989 23 | 607 12 | 284 11 | 323 1 |
| 2020-21 | 2,229 -90 | 1,636 -76 | 692 -31 | 944 -45 | 593 -14 | 281 -3 | 312 -11 |
| 2021-22 | 2,244 15 | 1,634 -2 | 706 14 | 928 -16 | 610 17 | 292 11 | 318 6 |
| 2022-23 | 2,092 -152 | 1,513 -121 | 650 -56 | 863 -65 | 579 -31 | 279 -13 | 300 -18 |
| Average | 2,211 | 1,565 | 644 | 922 | 646 | 301 | 345 |