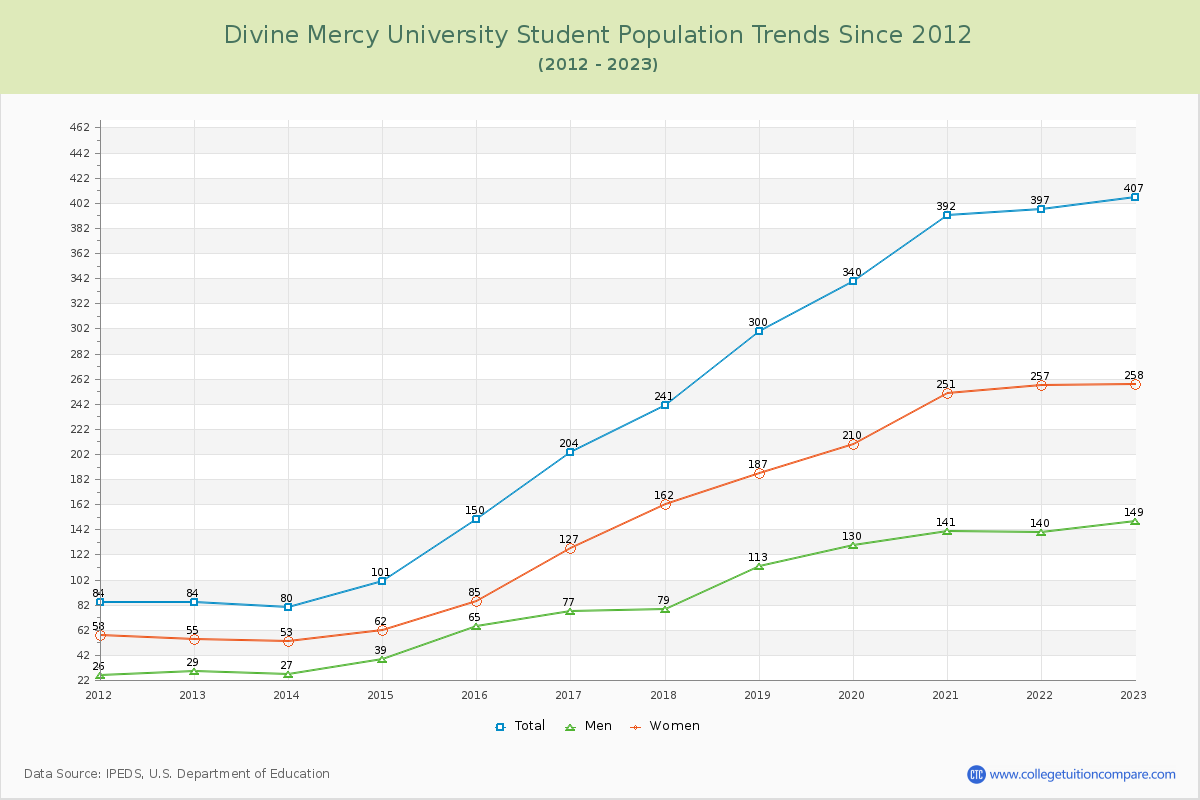
Student Population Changes
The average student population over the last 12 years is 245 where 407 students are attending the school for the academic year 2022-2023.
The female to male ratio is 1.73 to 1 and it means that there are more female students enrolled in DMU than male students.
The following table and chart illustrate the changes in student population by gender at Divine Mercy University since 2012.
| Year | Total | Men | Women |
|---|---|---|---|
| 2012-13 | 84 | 29 | 55 |
| 2013-14 | 80 -4 | 27 -2 | 53 -2 |
| 2014-15 | 101 21 | 39 12 | 62 9 |
| 2015-16 | 150 49 | 65 26 | 85 23 |
| 2016-17 | 204 54 | 77 12 | 127 42 |
| 2017-18 | 241 37 | 79 2 | 162 35 |
| 2018-19 | 300 59 | 113 34 | 187 25 |
| 2019-20 | 340 40 | 130 17 | 210 23 |
| 2020-21 | 392 52 | 141 11 | 251 41 |
| 2021-22 | 397 5 | 140 -1 | 257 6 |
| 2022-23 | 407 10 | 149 9 | 258 1 |
| Average | 245 | 90 | 155 |