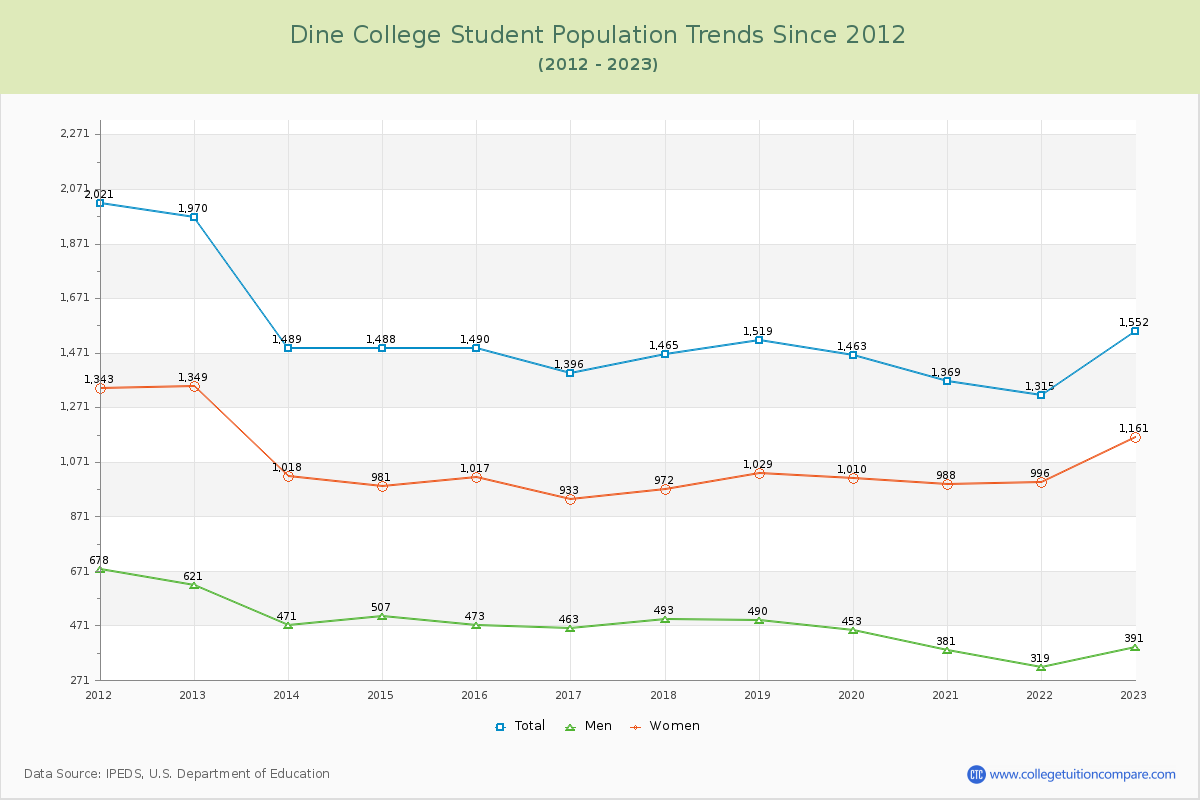
Student Population Changes
The average student population over the last 12 years is 1,501 where 1,552 students are attending the school for the academic year 2022-2023.
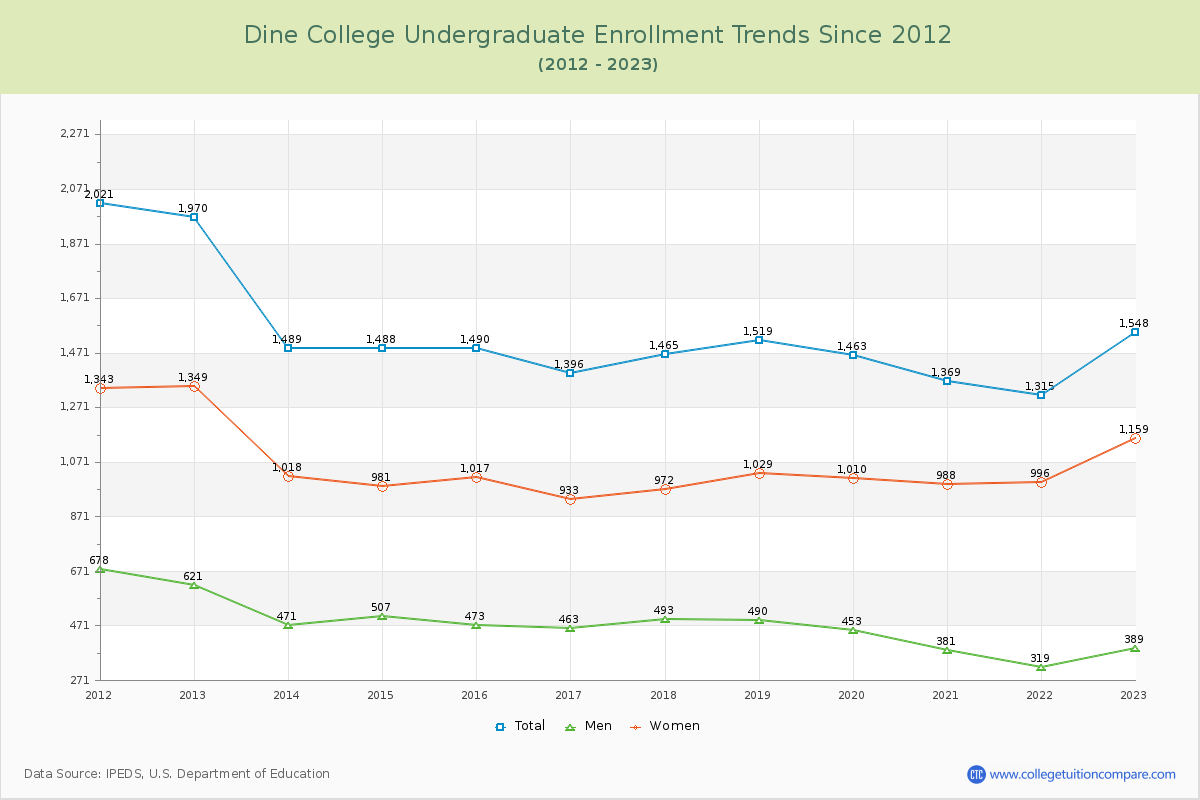
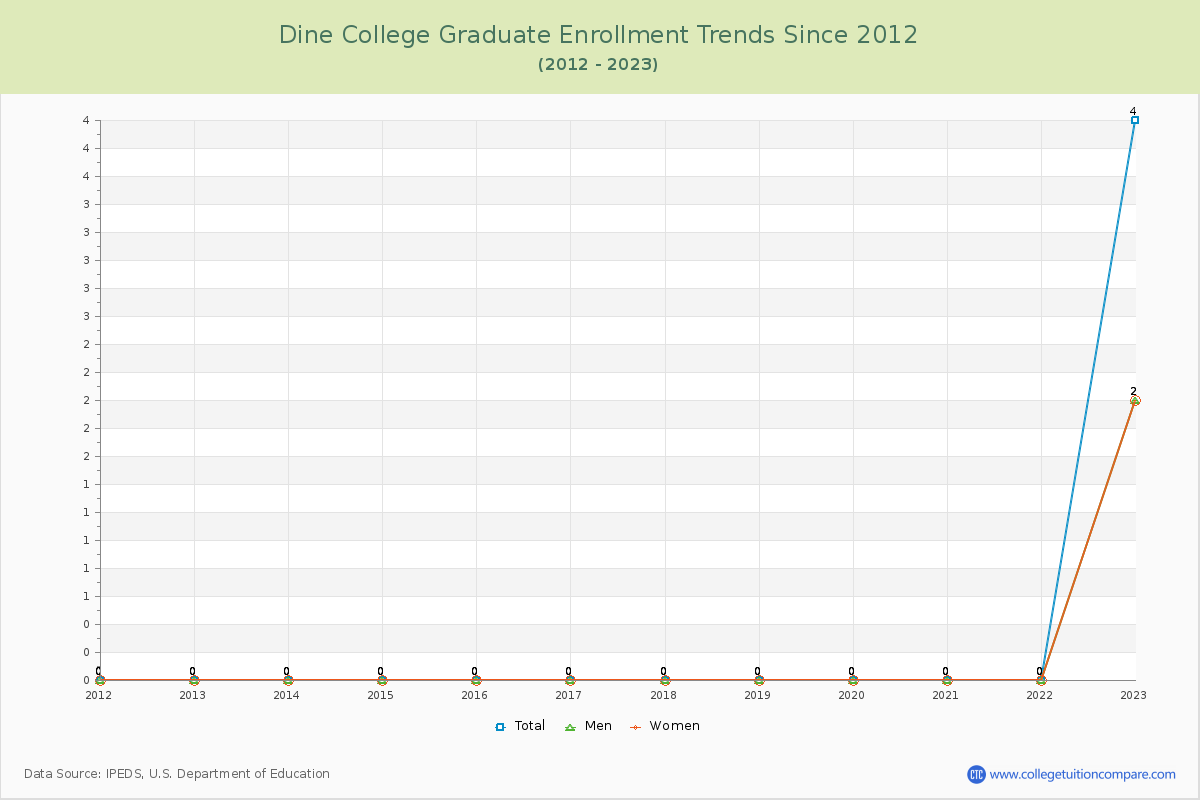
99.74% of total students is undergraduate students and 0.26% students is graduate students. The number of undergraduate students has decreased by 422 and the graduate enrollment has increased by 4 over past 10 years.
The female to male ratio is 2.97 to 1 and it means that there are far more female students enrolled in Dine than male students.
The following table and chart illustrate the changes in student population by gender at Dine College since 2012.
| Year | Total | Undergraduate | Graduate | ||||
|---|---|---|---|---|---|---|---|
| Total | Men | Women | Total | Men | Women | ||
| 2012-13 | 1,970 | 1,970 | 621 | 1,349 | 0 | 0 | 0 |
| 2013-14 | 1,489 -481 | 1,489 -481 | 471 -150 | 1,018 -331 | 0 0 | 0 0 | 0 0 |
| 2014-15 | 1,488 -1 | 1,488 -1 | 507 36 | 981 -37 | 0 0 | 0 0 | 0 0 |
| 2015-16 | 1,490 2 | 1,490 2 | 473 -34 | 1,017 36 | 0 0 | 0 0 | 0 0 |
| 2016-17 | 1,396 -94 | 1,396 -94 | 463 -10 | 933 -84 | 0 0 | 0 0 | 0 0 |
| 2017-18 | 1,465 69 | 1,465 69 | 493 30 | 972 39 | 0 0 | 0 0 | 0 0 |
| 2018-19 | 1,519 54 | 1,519 54 | 490 -3 | 1,029 57 | 0 0 | 0 0 | 0 0 |
| 2019-20 | 1,463 -56 | 1,463 -56 | 453 -37 | 1,010 -19 | 0 0 | 0 0 | 0 0 |
| 2020-21 | 1,369 -94 | 1,369 -94 | 381 -72 | 988 -22 | 0 0 | 0 0 | 0 0 |
| 2021-22 | 1,315 -54 | 1,315 -54 | 319 -62 | 996 8 | 0 0 | 0 0 | 0 0 |
| 2022-23 | 1,552 237 | 1,548 233 | 389 70 | 1,159 163 | 4 4 | 2 2 | 2 2 |
| Average | 1,501 | 1,501 | 460 | 1,041 | 0 | 0 | 0 |