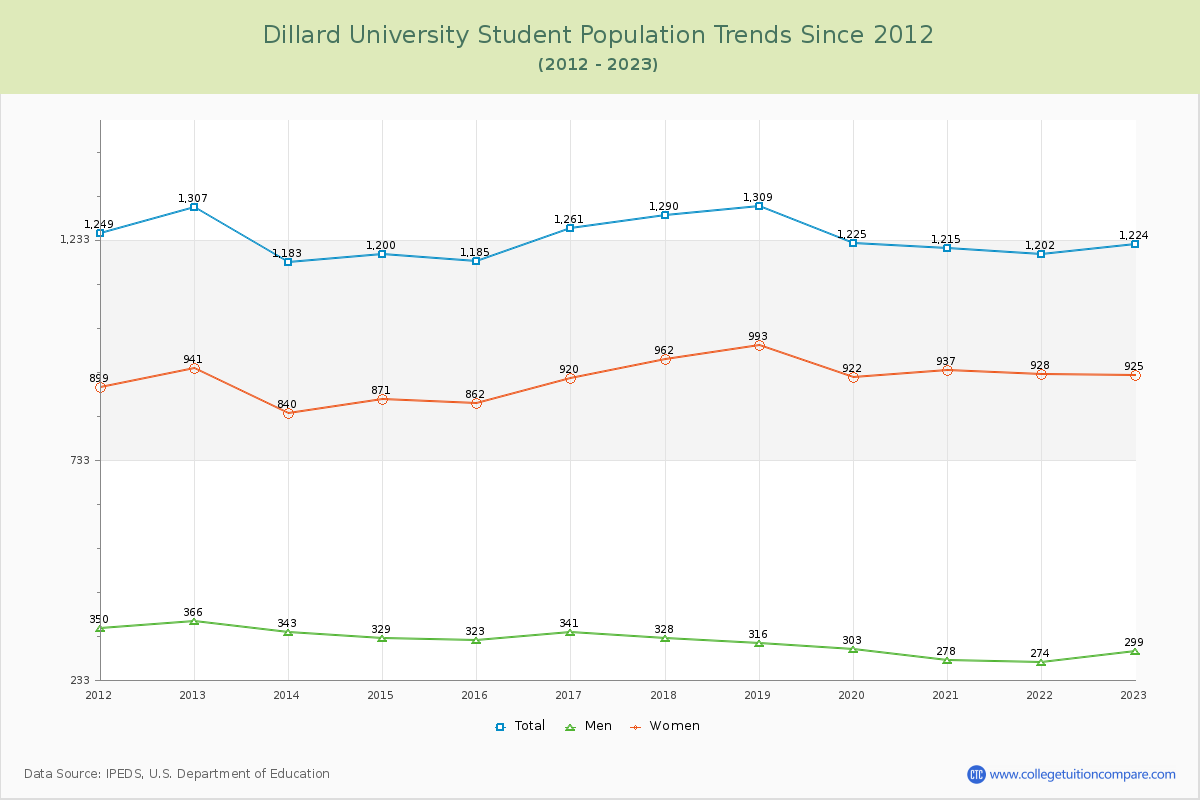
Student Population Changes
The average student population over the last 12 years is 1,236 where 1,224 students are attending the school for the academic year 2022-2023.
The female to male ratio is 3.09 to 1 and it means that there are far more female students enrolled in Dillard than male students.
The following table and chart illustrate the changes in student population by gender at Dillard University since 2012.
| Year | Total | Men | Women |
|---|---|---|---|
| 2012-13 | 1,307 | 366 | 941 |
| 2013-14 | 1,183 -124 | 343 -23 | 840 -101 |
| 2014-15 | 1,200 17 | 329 -14 | 871 31 |
| 2015-16 | 1,185 -15 | 323 -6 | 862 -9 |
| 2016-17 | 1,261 76 | 341 18 | 920 58 |
| 2017-18 | 1,290 29 | 328 -13 | 962 42 |
| 2018-19 | 1,309 19 | 316 -12 | 993 31 |
| 2019-20 | 1,225 -84 | 303 -13 | 922 -71 |
| 2020-21 | 1,215 -10 | 278 -25 | 937 15 |
| 2021-22 | 1,202 -13 | 274 -4 | 928 -9 |
| 2022-23 | 1,224 22 | 299 25 | 925 -3 |
| Average | 1,236 | 318 | 918 |