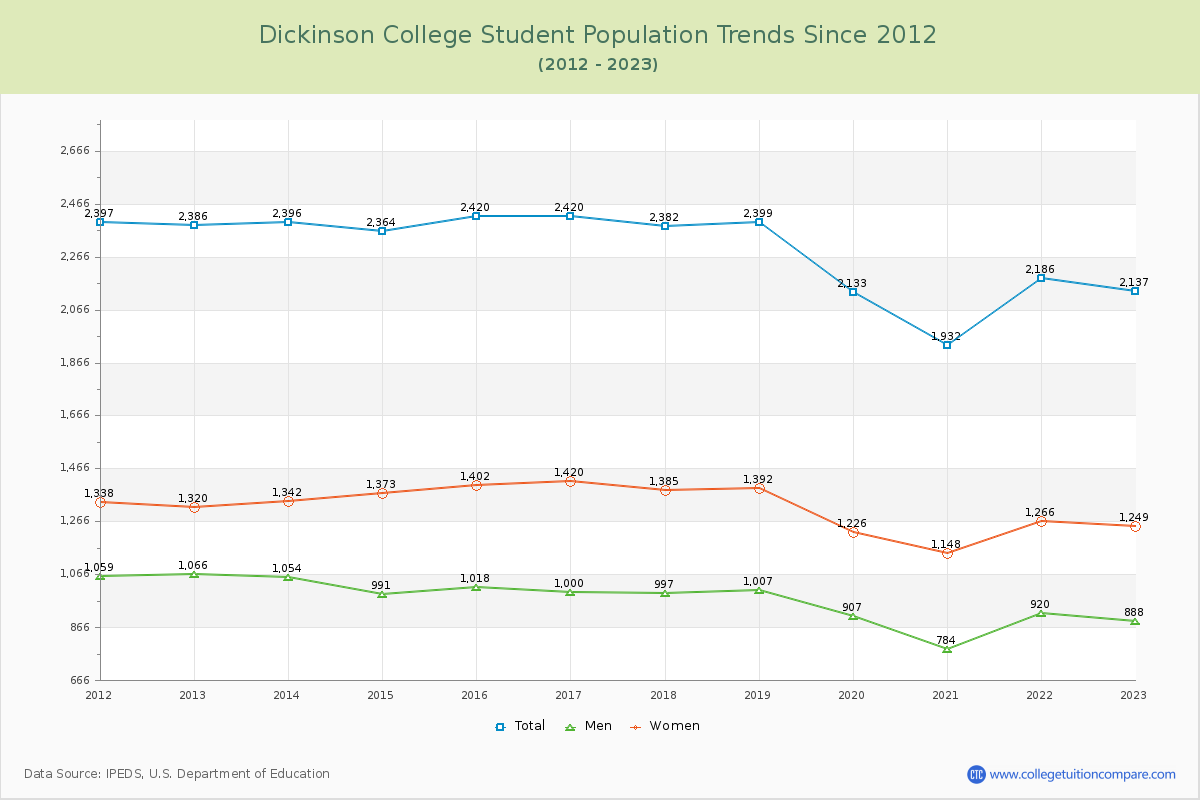
Student Population Changes
The average student population over the last 12 years is 2,287 where 2,137 students are attending the school for the academic year 2022-2023.
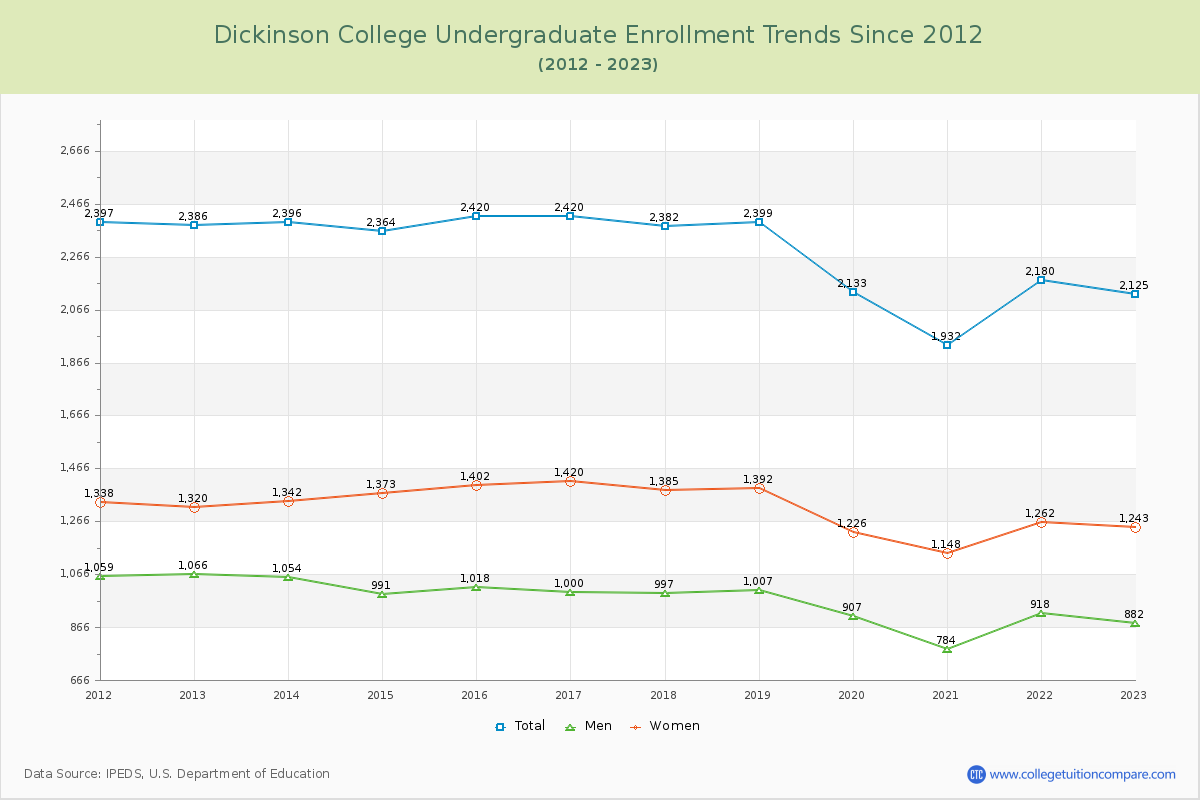
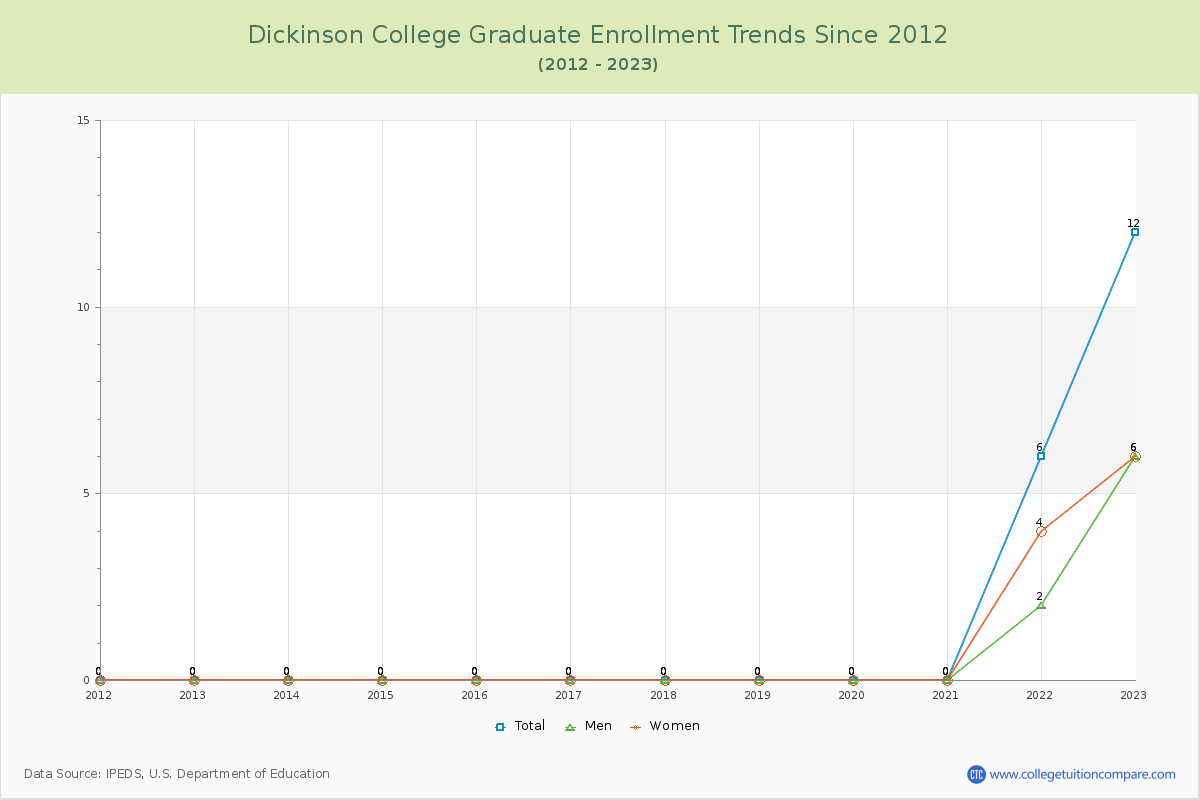
99.44% of total students is undergraduate students and 0.56% students is graduate students. The number of undergraduate students has decreased by 261 and the graduate enrollment has increased by 12 over past 10 years.
The female to male ratio is 1.41 to 1 and it means that there are more female students enrolled in Dickinson than male students.
The following table and chart illustrate the changes in student population by gender at Dickinson College since 2012.
| Year | Total | Undergraduate | Graduate | ||||
|---|---|---|---|---|---|---|---|
| Total | Men | Women | Total | Men | Women | ||
| 2012-13 | 2,386 | 2,386 | 1,066 | 1,320 | 0 | 0 | 0 |
| 2013-14 | 2,396 10 | 2,396 10 | 1,054 -12 | 1,342 22 | 0 0 | 0 0 | 0 0 |
| 2014-15 | 2,364 -32 | 2,364 -32 | 991 -63 | 1,373 31 | 0 0 | 0 0 | 0 0 |
| 2015-16 | 2,420 56 | 2,420 56 | 1,018 27 | 1,402 29 | 0 0 | 0 0 | 0 0 |
| 2016-17 | 2,420 0 | 2,420 0 | 1,000 -18 | 1,420 18 | 0 0 | 0 0 | 0 0 |
| 2017-18 | 2,382 -38 | 2,382 -38 | 997 -3 | 1,385 -35 | 0 0 | 0 0 | 0 0 |
| 2018-19 | 2,399 17 | 2,399 17 | 1,007 10 | 1,392 7 | 0 0 | 0 0 | 0 0 |
| 2019-20 | 2,133 -266 | 2,133 -266 | 907 -100 | 1,226 -166 | 0 0 | 0 0 | 0 0 |
| 2020-21 | 1,932 -201 | 1,932 -201 | 784 -123 | 1,148 -78 | 0 0 | 0 0 | 0 0 |
| 2021-22 | 2,186 254 | 2,180 248 | 918 134 | 1,262 114 | 6 6 | 2 2 | 4 4 |
| 2022-23 | 2,137 -49 | 2,125 -55 | 882 -36 | 1,243 -19 | 12 6 | 6 4 | 6 2 |
| Average | 2,287 | 2,285 | 966 | 1,319 | 2 | 1 | 1 |