Enrollment Trends at Dewey University-Hato Rey

-532

Total Enrollment

-189

Men

-343

Women

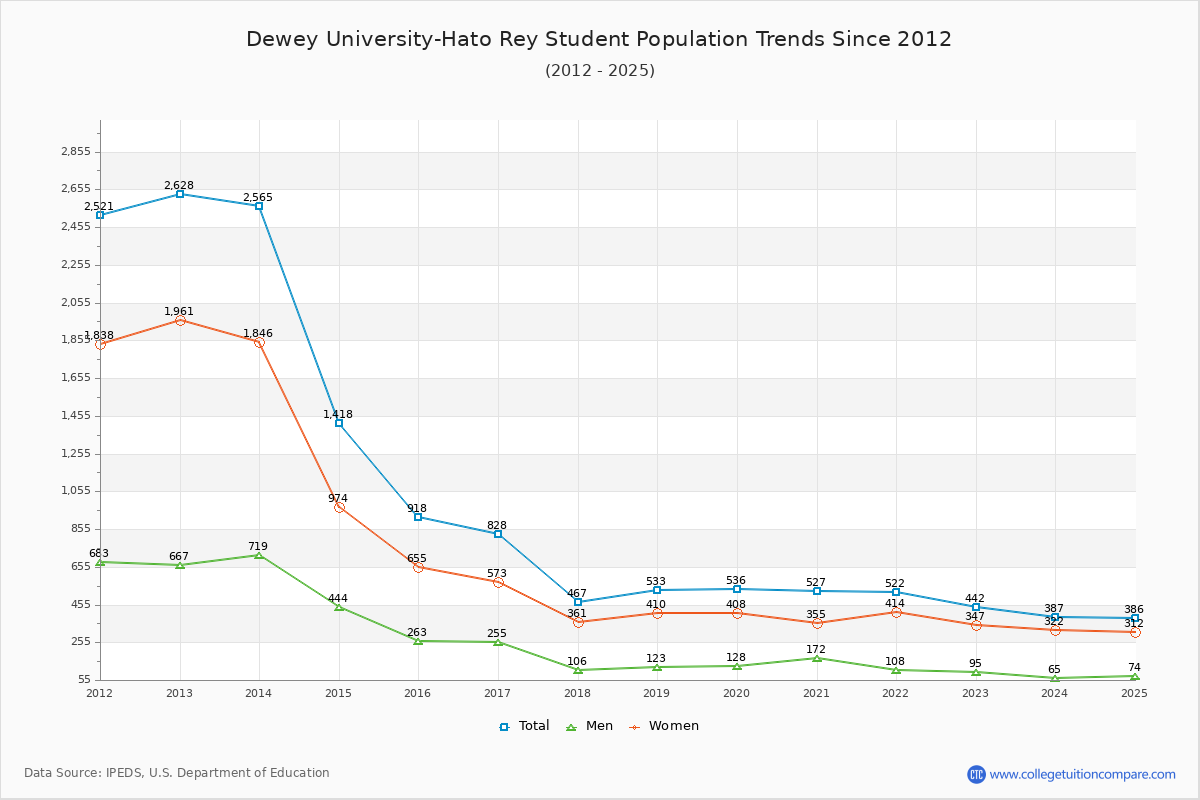
The student population at Dewey University-Hato Rey is 386 (244 undergraduate and 142 graduate students) . The number of students has decreased by 532 over the past decade.

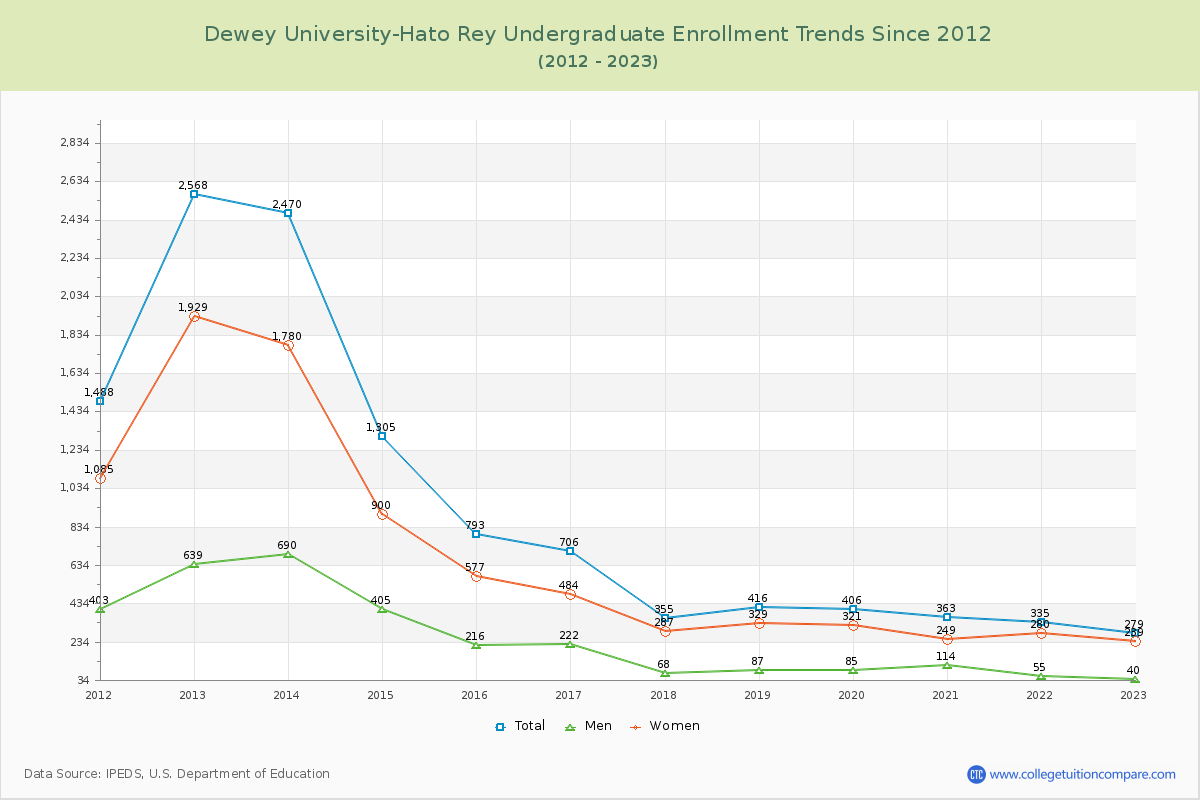
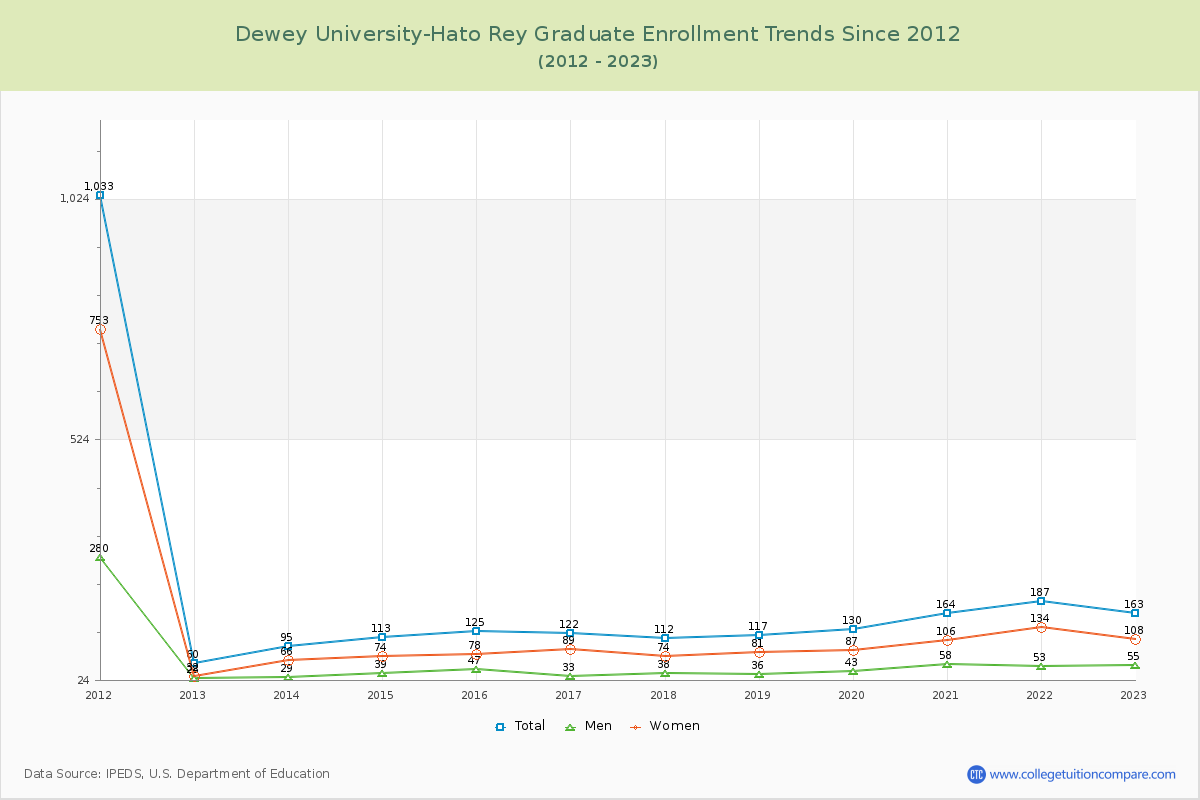
The percentage of undergraduate students at Dewey University-Hato Rey is 63.21% which is decreased by 549 over last 10 years. The graduate student population increased by 17 and it has been increasing.

The female to male ratio is 4.22 to 1 which means that majority of population is on female students.

All students have enrolled in on-campus classes (Dewey University-Hato Rey does not offer online degree/certificate program).

Student Population Changes

The average student population over the last 11 years is 555 where 386 students are attending the school for the academic year 2024-2025.

63.21% of total students is undergraduate students and 36.79% students is graduate students. The number of undergraduate students has decreased by 549 and the graduate enrollment has increased by 17 over past 10 years.

The female to male ratio is 4.22 to 1 and it means that there are far more female students enrolled in Dewey University-Hato Rey than male students.

The following table and chart illustrate the changes in student population by gender at Dewey University-Hato Rey since 2015.

YearTotalUndergraduateGraduate
TotalMenWomenTotalMenWomen
2015-169187932165771254778
2016-17828
-90
706
-87
222
6
484
-93
122
-3
33
-14
89
11
2017-18467
-361
355
-351
68
-154
287
-197
112
-10
38
5
74
-15
2018-19533
66
416
61
87
19
329
42
117
5
36
-2
81
7
2019-20536
3
406
-10
85
-2
321
-8
130
13
43
7
87
6
2020-21527
-9
363
-43
114
29
249
-72
164
34
58
15
106
19
2021-22522
-5
335
-28
55
-59
280
31
187
23
53
-5
134
28
2022-23442
-80
279
-56
40
-15
239
-41
163
-24
55
2
108
-26
2023-24387
-55
270
-9
36
-4
234
-5
117
-46
29
-26
88
-20
2024-25386
-1
244
-26
33
-3
211
-23
142
25
41
12
101
13
Average555417963211384395
Dewey University-Hato Rey Enrollment Trends Chart

Undergraduate Enrollment Changes

The average number of Undergraduate students over the last 11 years is 417 where 244 students are attending the Undergraduate school for the academic year 2024-2025. The following table and chart illustrate the changes in Undergraduate enrollment by attending status and gender at Dewey University-Hato Rey since 2015.

YearTotalFull-timePart-time
TotalMenWomenTotalMenWomen
2015-1679356716240522654172
2016-1770648517231322150171
2017-183552385318511715102
2018-194162785822013829109
2019-204062594721214738109
2020-21363225691561384593
2021-223352093717212618108
2022-232791472212513218114
2023-24270167241431031291
2024-2524414517128991683
Average4174176620641730115
Dewey University-Hato Rey Undergraduate Enrollment Trends Chart

Graduate Enrollment Changes

The average number of Graduate students over the last 11 years is 138 where 142 students are attending the Graduate school for the academic year 2024-2025. The following table and chart illustrate the changes in Graduate enrollment by attending status and gender at Dewey University-Hato Rey since 2015.

YearTotalFull-timePart-time
TotalMenWomenTotalMenWomen
2015-16125782949471829
2016-1712282245840931
2017-18112842658281216
2018-191171113378633
2019-201301223983844
2020-211641314685331221
2021-2218714340103441331
2022-2316315152991239
2023-241171102882716
2024-251421053174371027
Average1381383577138918
Dewey University-Hato Rey Graduate Enrollment Trends Chart

Enrollment by Race/Ethnicity Changes

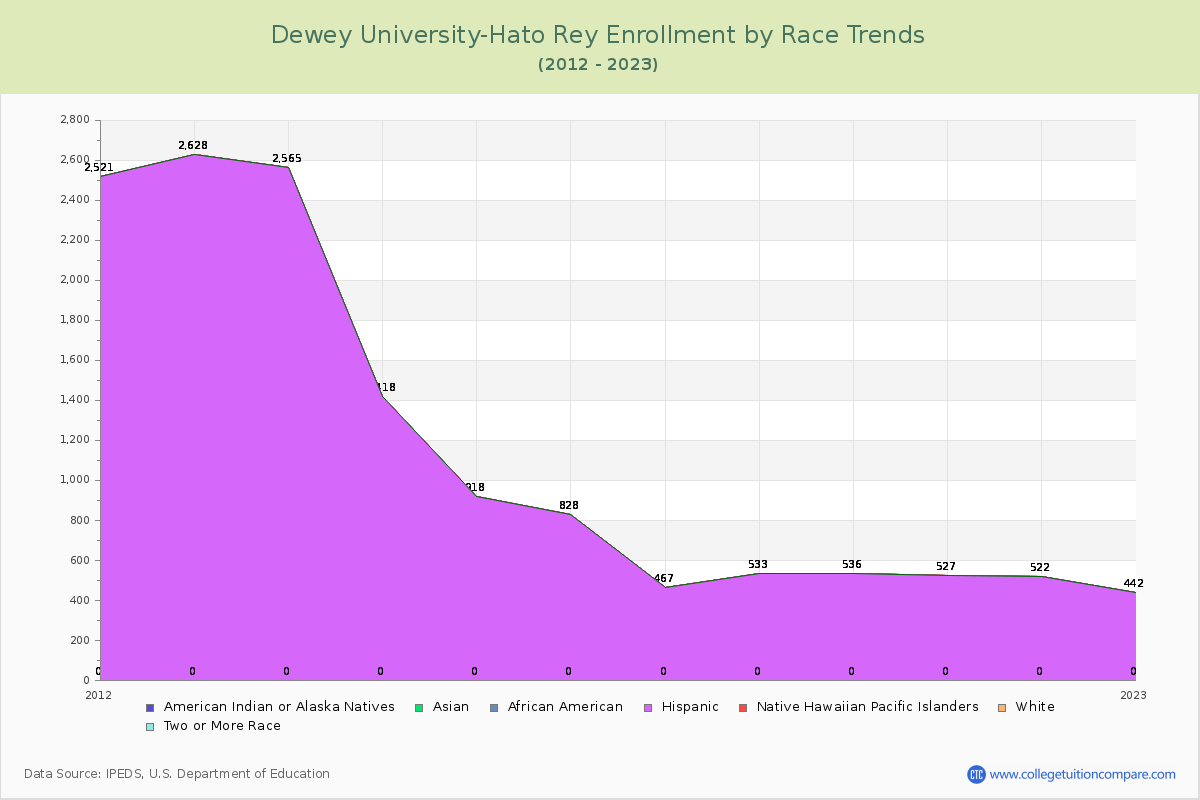
The percentage of white students is 0.00% and the percentage of black students is 0.00% at Dewey University-Hato Rey. Hispanic students comprise 100.00% of the student body.

Over the past 10 years, the racial composition has remained relatively stable. The percentage of white students decreased from 0.00% to 0.00%.

The overall racial diversity, measured by the Census Bureau Diversity Index, is 0.0000 which indicates that not very diverse. This decreased from 0.0000 a decade ago, suggesting that racial diversity has declined.

The following table and chart illustrate the student population trends by race/ethnicity at Dewey University-Hato Rey over the past 11 years (2015-2025).

YearAmerican Indian or Native AmericanAsianBlackHispanicNative Hawaiian or Other Pacific IslanderWhiteTwo or More Races
2015-16000918000
2016-17000828000
2017-18000467000
2018-19000533000
2019-20000536000
2020-21000527000
2021-22000522000
2022-23000442000
2023-24000387000
2024-25000386000
Average000555000
Dewey University-Hato Rey Enrollment by Race Trends Chart

Distance Learning (Online Courses) Enrollment Changes

Dewey University-Hato Rey does not offer online degree/certificate programs. All Students have enrolled in on-campus programs.


Ratings & Review

Share your experiences and thoughts about Dewey University-Hato Rey. It will be a great help to applicants and prospective students!