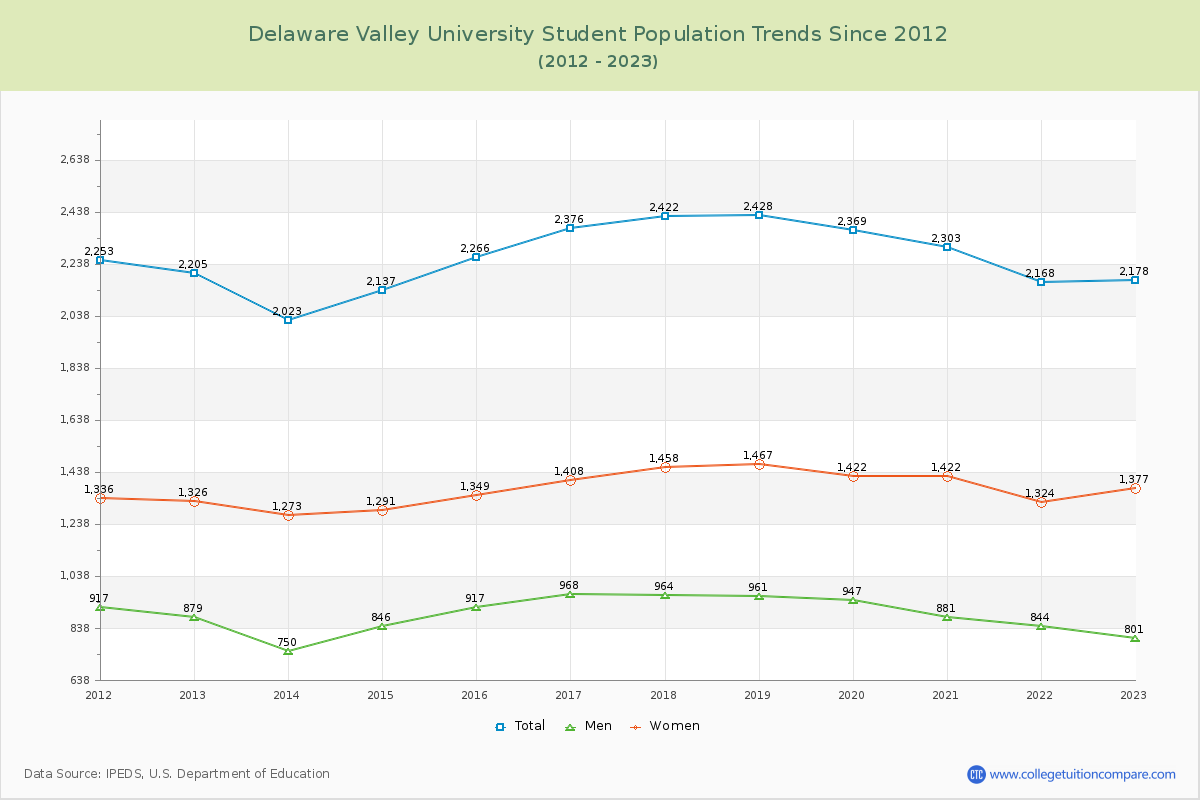
Student Population Changes
The average student population over the last 12 years is 2,261 where 2,178 students are attending the school for the academic year 2022-2023.
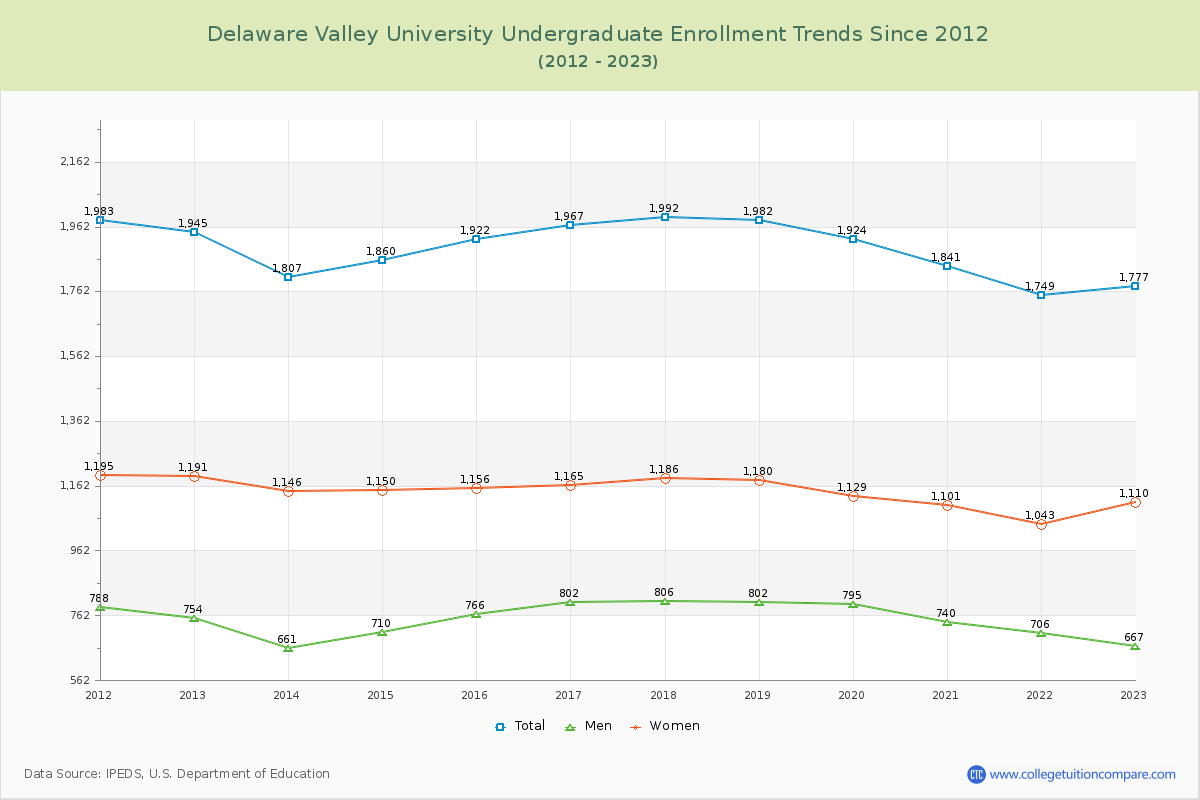
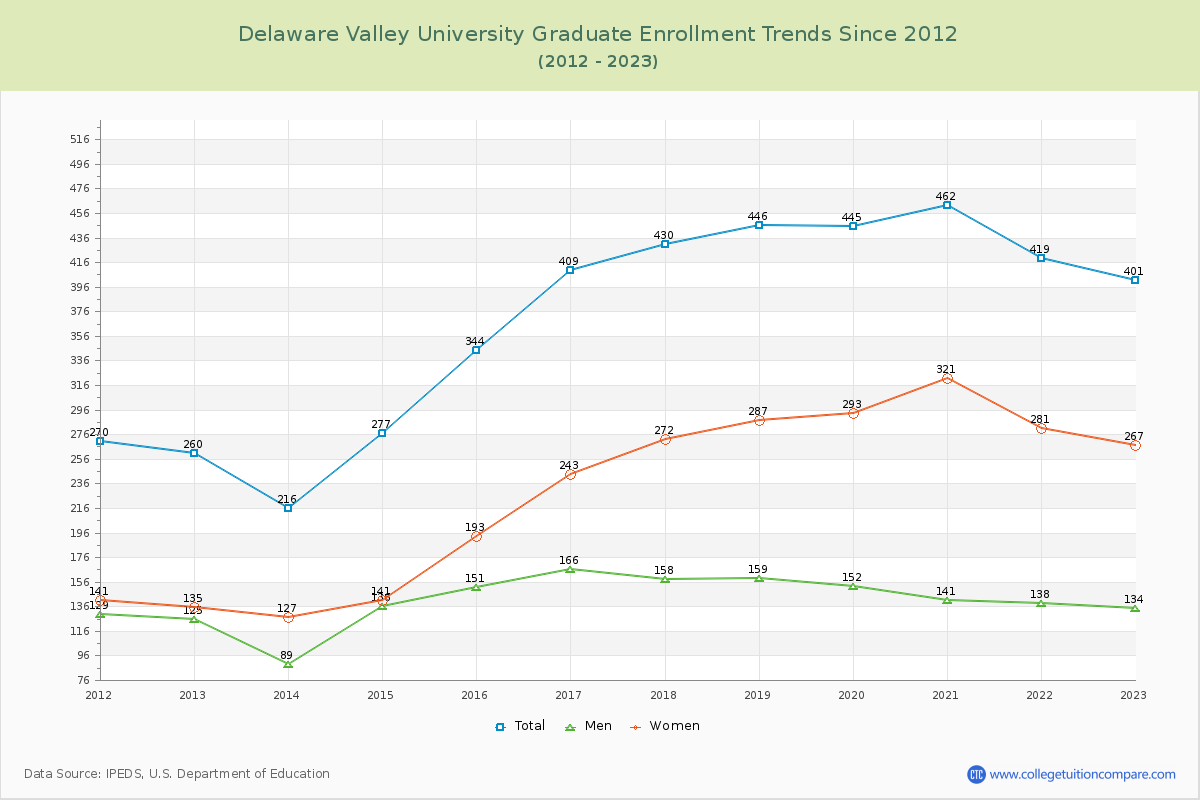
81.59% of total students is undergraduate students and 18.41% students is graduate students. The number of undergraduate students has decreased by 168 and the graduate enrollment has increased by 141 over past 10 years.
The female to male ratio is 1.72 to 1 and it means that there are more female students enrolled in Delaware Valley than male students.
The following table and chart illustrate the changes in student population by gender at Delaware Valley University since 2012.
| Year | Total | Undergraduate | Graduate | ||||
|---|---|---|---|---|---|---|---|
| Total | Men | Women | Total | Men | Women | ||
| 2012-13 | 2,205 | 1,945 | 754 | 1,191 | 260 | 125 | 135 |
| 2013-14 | 2,023 -182 | 1,807 -138 | 661 -93 | 1,146 -45 | 216 -44 | 89 -36 | 127 -8 |
| 2014-15 | 2,137 114 | 1,860 53 | 710 49 | 1,150 4 | 277 61 | 136 47 | 141 14 |
| 2015-16 | 2,266 129 | 1,922 62 | 766 56 | 1,156 6 | 344 67 | 151 15 | 193 52 |
| 2016-17 | 2,376 110 | 1,967 45 | 802 36 | 1,165 9 | 409 65 | 166 15 | 243 50 |
| 2017-18 | 2,422 46 | 1,992 25 | 806 4 | 1,186 21 | 430 21 | 158 -8 | 272 29 |
| 2018-19 | 2,428 6 | 1,982 -10 | 802 -4 | 1,180 -6 | 446 16 | 159 1 | 287 15 |
| 2019-20 | 2,369 -59 | 1,924 -58 | 795 -7 | 1,129 -51 | 445 -1 | 152 -7 | 293 6 |
| 2020-21 | 2,303 -66 | 1,841 -83 | 740 -55 | 1,101 -28 | 462 17 | 141 -11 | 321 28 |
| 2021-22 | 2,168 -135 | 1,749 -92 | 706 -34 | 1,043 -58 | 419 -43 | 138 -3 | 281 -40 |
| 2022-23 | 2,178 10 | 1,777 28 | 667 -39 | 1,110 67 | 401 -18 | 134 -4 | 267 -14 |
| Average | 2,261 | 1,888 | 746 | 1,142 | 374 | 141 | 233 |