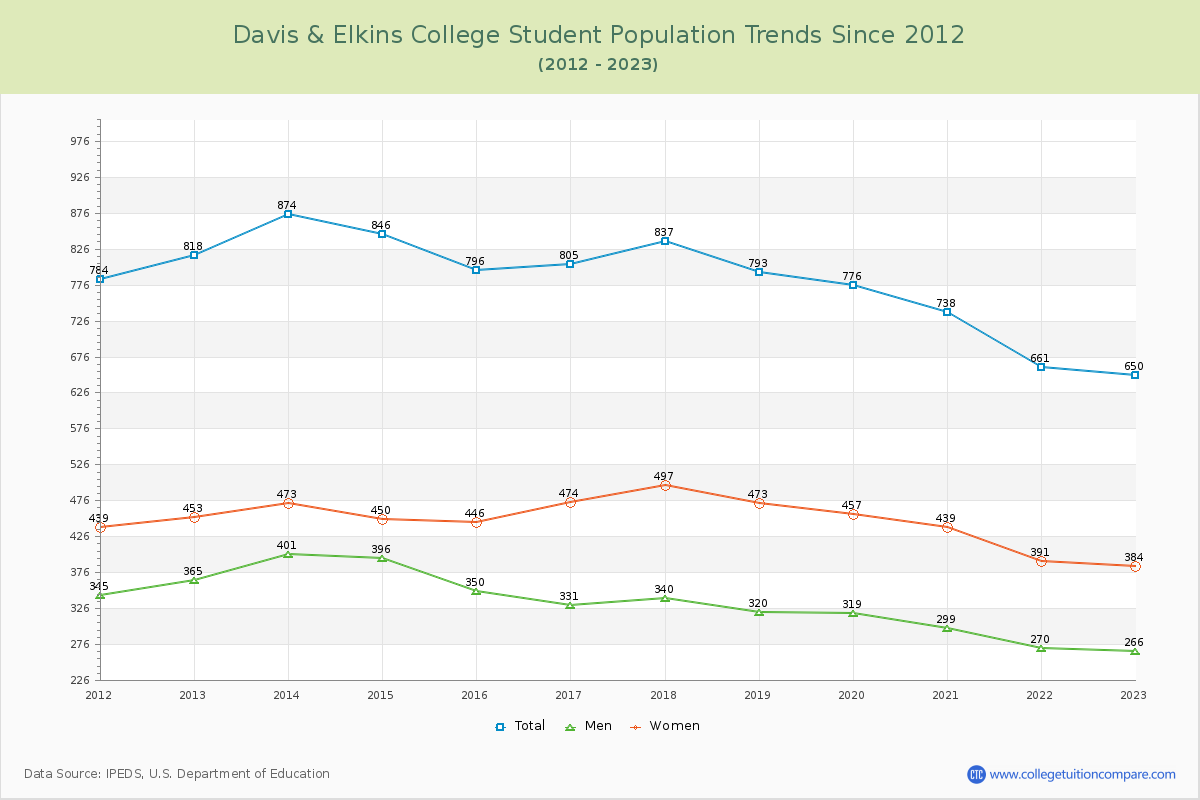
Student Population Changes
The average student population over the last 12 years is 781 where 650 students are attending the school for the academic year 2022-2023.
The female to male ratio is 1.44 to 1 and it means that there are more female students enrolled in D&E than male students.
The following table and chart illustrate the changes in student population by gender at Davis & Elkins College since 2012.
| Year | Total | Men | Women |
|---|---|---|---|
| 2012-13 | 818 | 365 | 453 |
| 2013-14 | 874 56 | 401 36 | 473 20 |
| 2014-15 | 846 -28 | 396 -5 | 450 -23 |
| 2015-16 | 796 -50 | 350 -46 | 446 -4 |
| 2016-17 | 805 9 | 331 -19 | 474 28 |
| 2017-18 | 837 32 | 340 9 | 497 23 |
| 2018-19 | 793 -44 | 320 -20 | 473 -24 |
| 2019-20 | 776 -17 | 319 -1 | 457 -16 |
| 2020-21 | 738 -38 | 299 -20 | 439 -18 |
| 2021-22 | 661 -77 | 270 -29 | 391 -48 |
| 2022-23 | 650 -11 | 266 -4 | 384 -7 |
| Average | 781 | 332 | 449 |