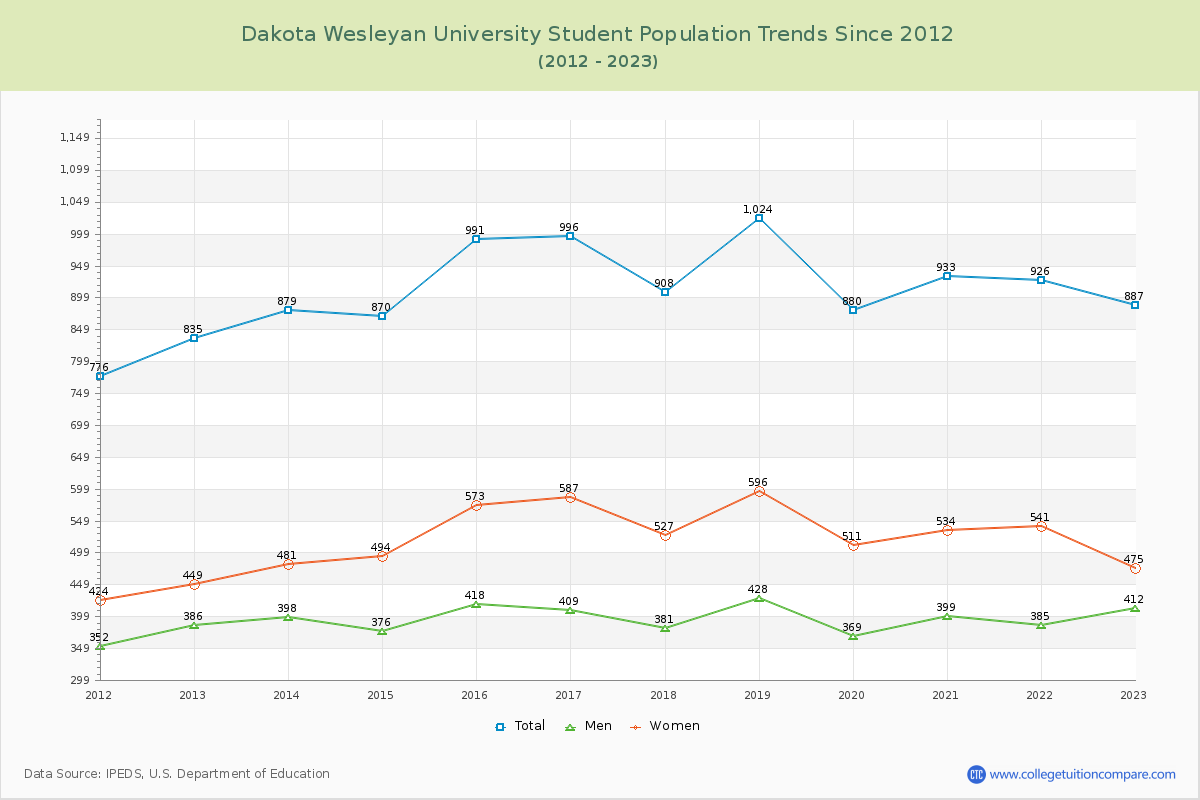
Student Population Changes
The average student population over the last 12 years is 921 where 887 students are attending the school for the academic year 2022-2023.
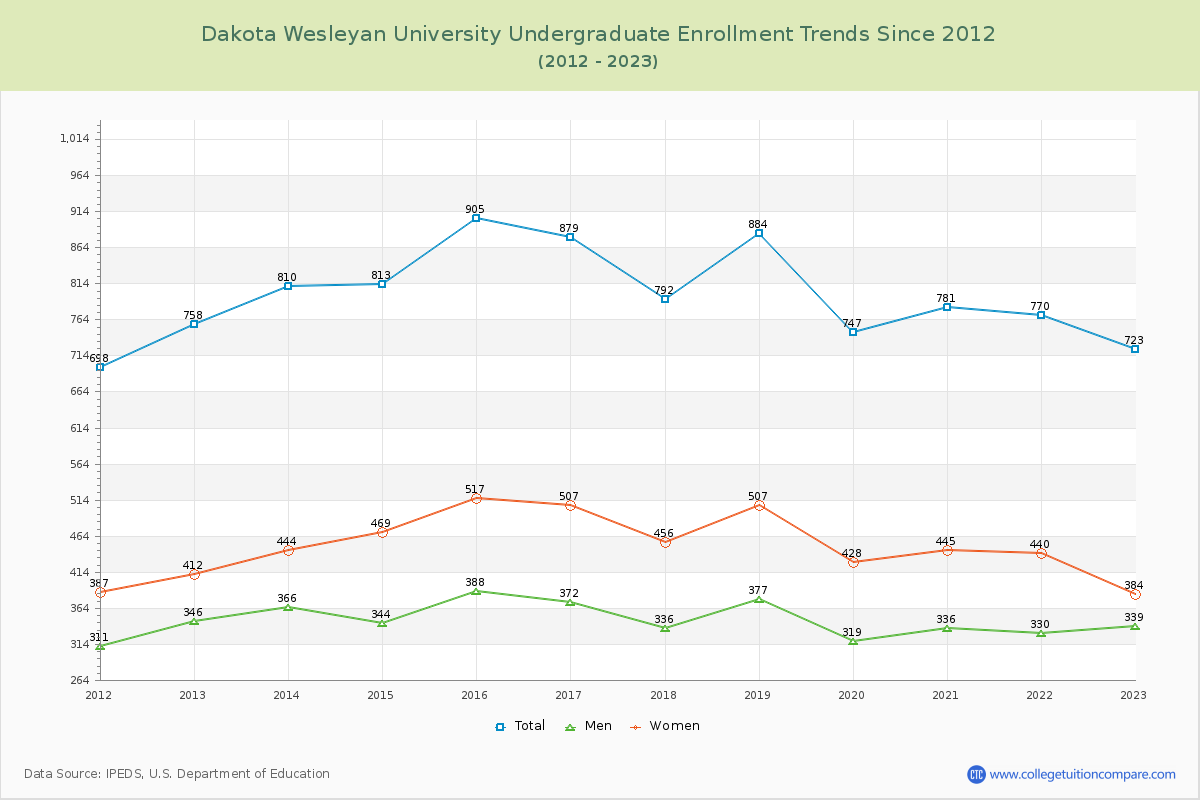
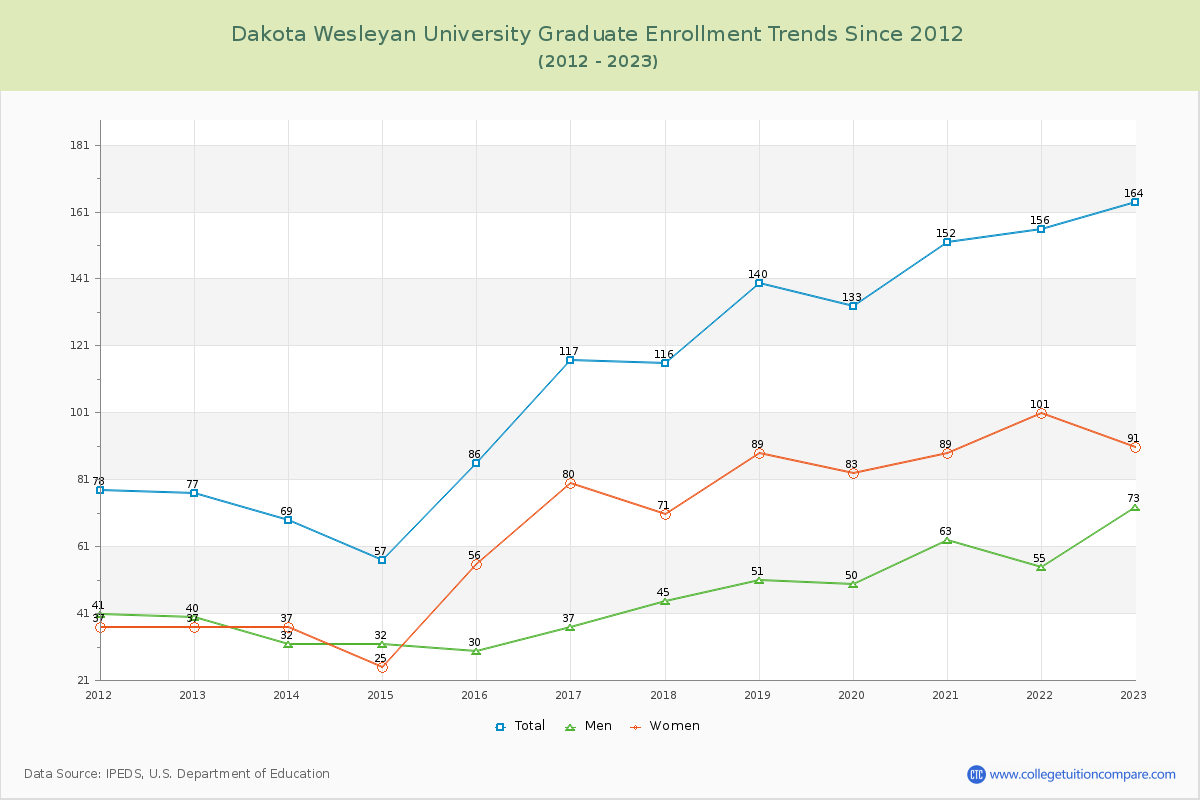
81.51% of total students is undergraduate students and 18.49% students is graduate students. The number of undergraduate students has decreased by 35 and the graduate enrollment has increased by 87 over past 10 years.
The female to male ratio is 1.15 to 1 and it means that there are slightly more female students enrolled in Dakota Wesleyan than male students.
The following table and chart illustrate the changes in student population by gender at Dakota Wesleyan University since 2012.
| Year | Total | Undergraduate | Graduate | ||||
|---|---|---|---|---|---|---|---|
| Total | Men | Women | Total | Men | Women | ||
| 2012-13 | 835 | 758 | 346 | 412 | 77 | 40 | 37 |
| 2013-14 | 879 44 | 810 52 | 366 20 | 444 32 | 69 -8 | 32 -8 | 37 0 |
| 2014-15 | 870 -9 | 813 3 | 344 -22 | 469 25 | 57 -12 | 32 0 | 25 -12 |
| 2015-16 | 991 121 | 905 92 | 388 44 | 517 48 | 86 29 | 30 -2 | 56 31 |
| 2016-17 | 996 5 | 879 -26 | 372 -16 | 507 -10 | 117 31 | 37 7 | 80 24 |
| 2017-18 | 908 -88 | 792 -87 | 336 -36 | 456 -51 | 116 -1 | 45 8 | 71 -9 |
| 2018-19 | 1,024 116 | 884 92 | 377 41 | 507 51 | 140 24 | 51 6 | 89 18 |
| 2019-20 | 880 -144 | 747 -137 | 319 -58 | 428 -79 | 133 -7 | 50 -1 | 83 -6 |
| 2020-21 | 933 53 | 781 34 | 336 17 | 445 17 | 152 19 | 63 13 | 89 6 |
| 2021-22 | 926 -7 | 770 -11 | 330 -6 | 440 -5 | 156 4 | 55 -8 | 101 12 |
| 2022-23 | 887 -39 | 723 -47 | 339 9 | 384 -56 | 164 8 | 73 18 | 91 -10 |
| Average | 921 | 806 | 350 | 455 | 115 | 46 | 69 |