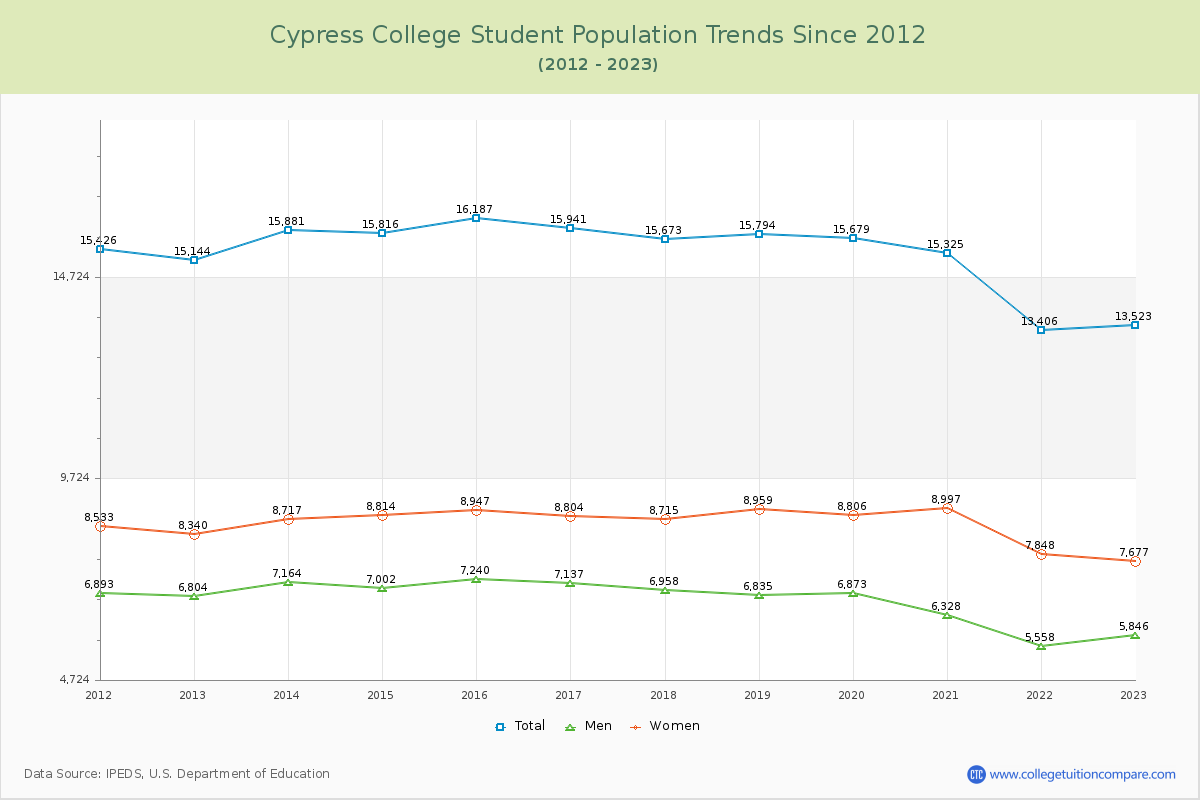
Student Population Changes
The average student population over the last 12 years is 15,306 where 13,523 students are attending the school for the academic year 2022-2023.
The female to male ratio is 1.31 to 1 and it means that there are more female students enrolled in Cypress than male students.
The following table and chart illustrate the changes in student population by gender at Cypress College since 2012.
| Year | Total | Men | Women |
|---|---|---|---|
| 2012-13 | 15,144 | 6,804 | 8,340 |
| 2013-14 | 15,881 737 | 7,164 360 | 8,717 377 |
| 2014-15 | 15,816 -65 | 7,002 -162 | 8,814 97 |
| 2015-16 | 16,187 371 | 7,240 238 | 8,947 133 |
| 2016-17 | 15,941 -246 | 7,137 -103 | 8,804 -143 |
| 2017-18 | 15,673 -268 | 6,958 -179 | 8,715 -89 |
| 2018-19 | 15,794 121 | 6,835 -123 | 8,959 244 |
| 2019-20 | 15,679 -115 | 6,873 38 | 8,806 -153 |
| 2020-21 | 15,325 -354 | 6,328 -545 | 8,997 191 |
| 2021-22 | 13,406 -1,919 | 5,558 -770 | 7,848 -1,149 |
| 2022-23 | 13,523 117 | 5,846 288 | 7,677 -171 |
| Average | 15,306 | 6,704 | 8,602 |