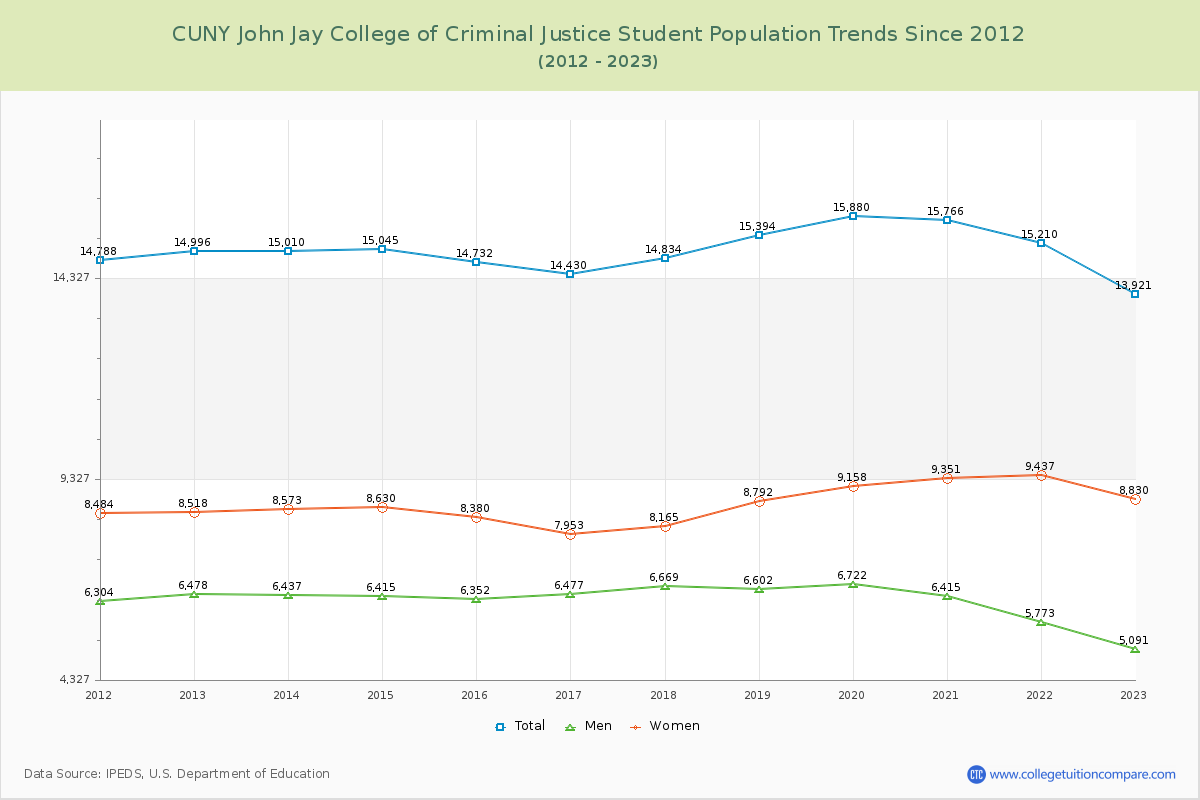
Student Population Changes
The average student population over the last 12 years is 15,020 where 13,921 students are attending the school for the academic year 2022-2023.
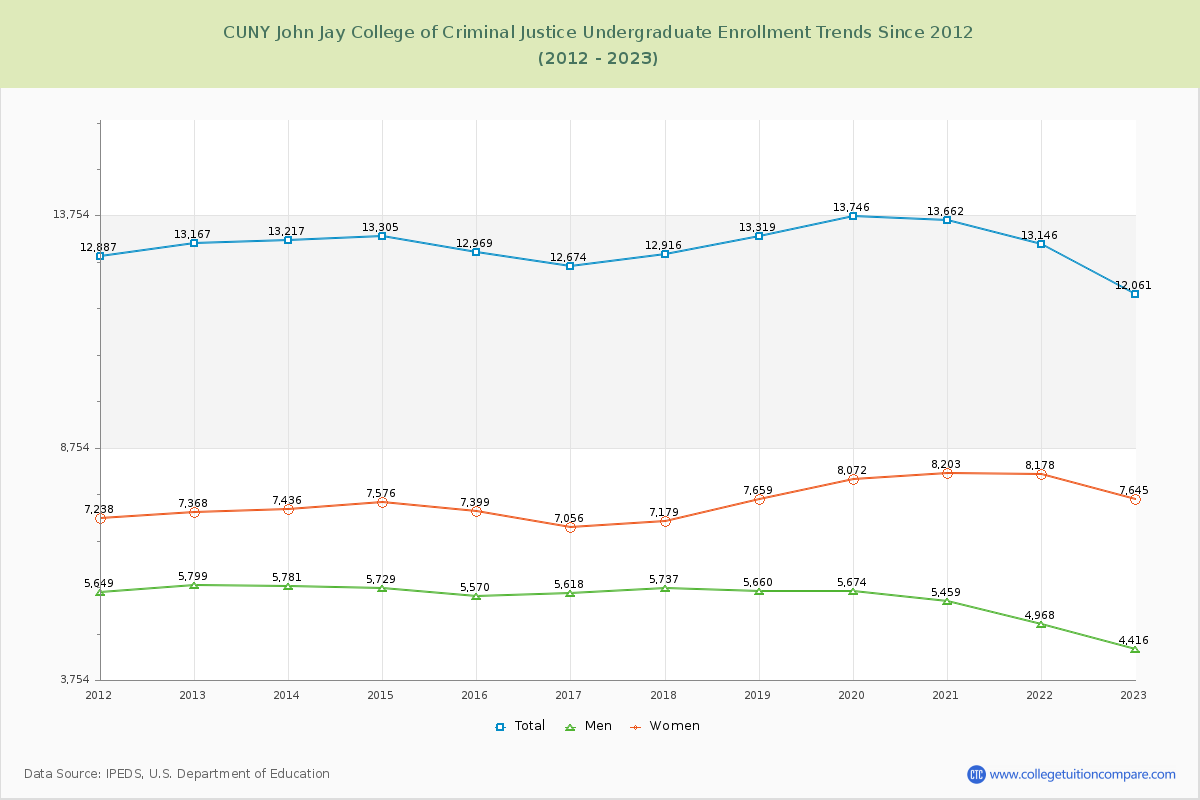
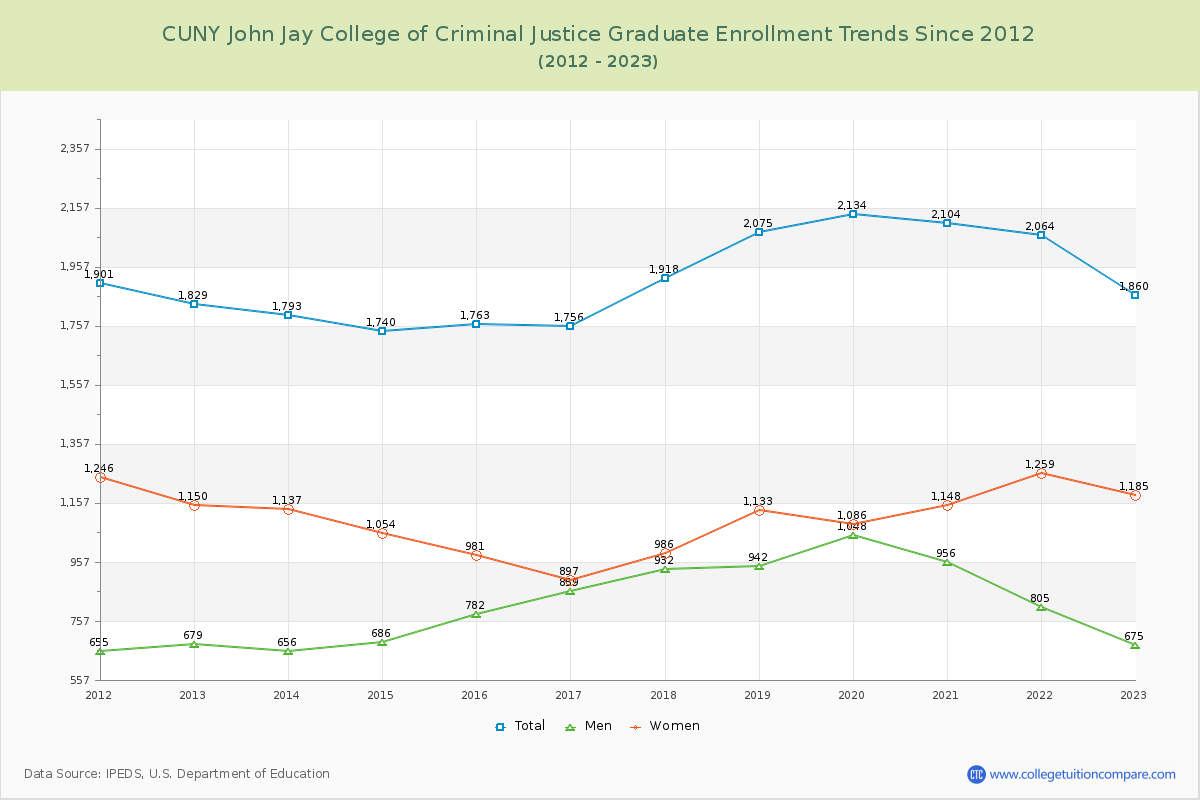
86.64% of total students is undergraduate students and 13.36% students is graduate students. The number of undergraduate students has decreased by 1,106 and the graduate enrollment has increased by 31 over past 10 years.
The female to male ratio is 1.73 to 1 and it means that there are more female students enrolled in John Jay than male students.
The following table and chart illustrate the changes in student population by gender at CUNY John Jay College of Criminal Justice since 2012.
| Year | Total | Undergraduate | Graduate | ||||
|---|---|---|---|---|---|---|---|
| Total | Men | Women | Total | Men | Women | ||
| 2012-13 | 14,996 | 13,167 | 5,799 | 7,368 | 1,829 | 679 | 1,150 |
| 2013-14 | 15,010 14 | 13,217 50 | 5,781 -18 | 7,436 68 | 1,793 -36 | 656 -23 | 1,137 -13 |
| 2014-15 | 15,045 35 | 13,305 88 | 5,729 -52 | 7,576 140 | 1,740 -53 | 686 30 | 1,054 -83 |
| 2015-16 | 14,732 -313 | 12,969 -336 | 5,570 -159 | 7,399 -177 | 1,763 23 | 782 96 | 981 -73 |
| 2016-17 | 14,430 -302 | 12,674 -295 | 5,618 48 | 7,056 -343 | 1,756 -7 | 859 77 | 897 -84 |
| 2017-18 | 14,834 404 | 12,916 242 | 5,737 119 | 7,179 123 | 1,918 162 | 932 73 | 986 89 |
| 2018-19 | 15,394 560 | 13,319 403 | 5,660 -77 | 7,659 480 | 2,075 157 | 942 10 | 1,133 147 |
| 2019-20 | 15,880 486 | 13,746 427 | 5,674 14 | 8,072 413 | 2,134 59 | 1,048 106 | 1,086 -47 |
| 2020-21 | 15,766 -114 | 13,662 -84 | 5,459 -215 | 8,203 131 | 2,104 -30 | 956 -92 | 1,148 62 |
| 2021-22 | 15,210 -556 | 13,146 -516 | 4,968 -491 | 8,178 -25 | 2,064 -40 | 805 -151 | 1,259 111 |
| 2022-23 | 13,921 -1,289 | 12,061 -1,085 | 4,416 -552 | 7,645 -533 | 1,860 -204 | 675 -130 | 1,185 -74 |
| Average | 15,020 | 13,107 | 5,492 | 7,616 | 1,912 | 820 | 1,092 |