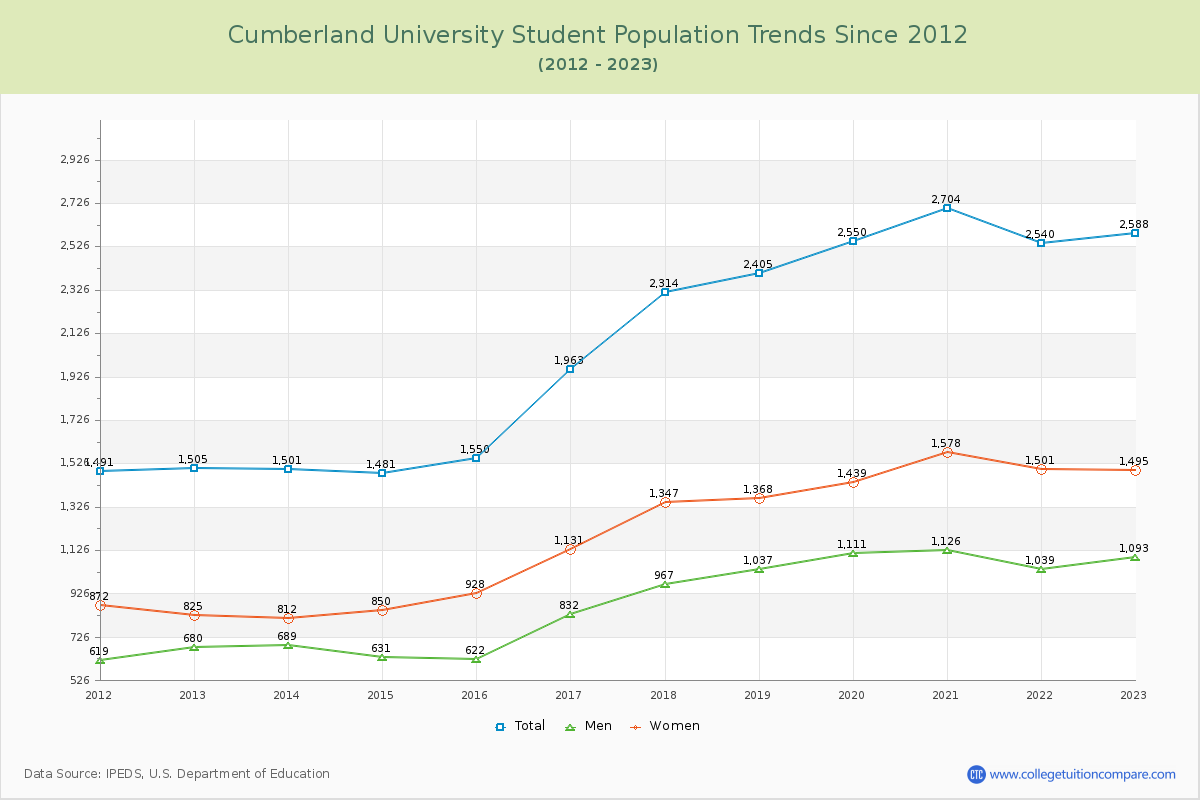
Student Population Changes
The average student population over the last 12 years is 2,100 where 2,588 students are attending the school for the academic year 2022-2023.
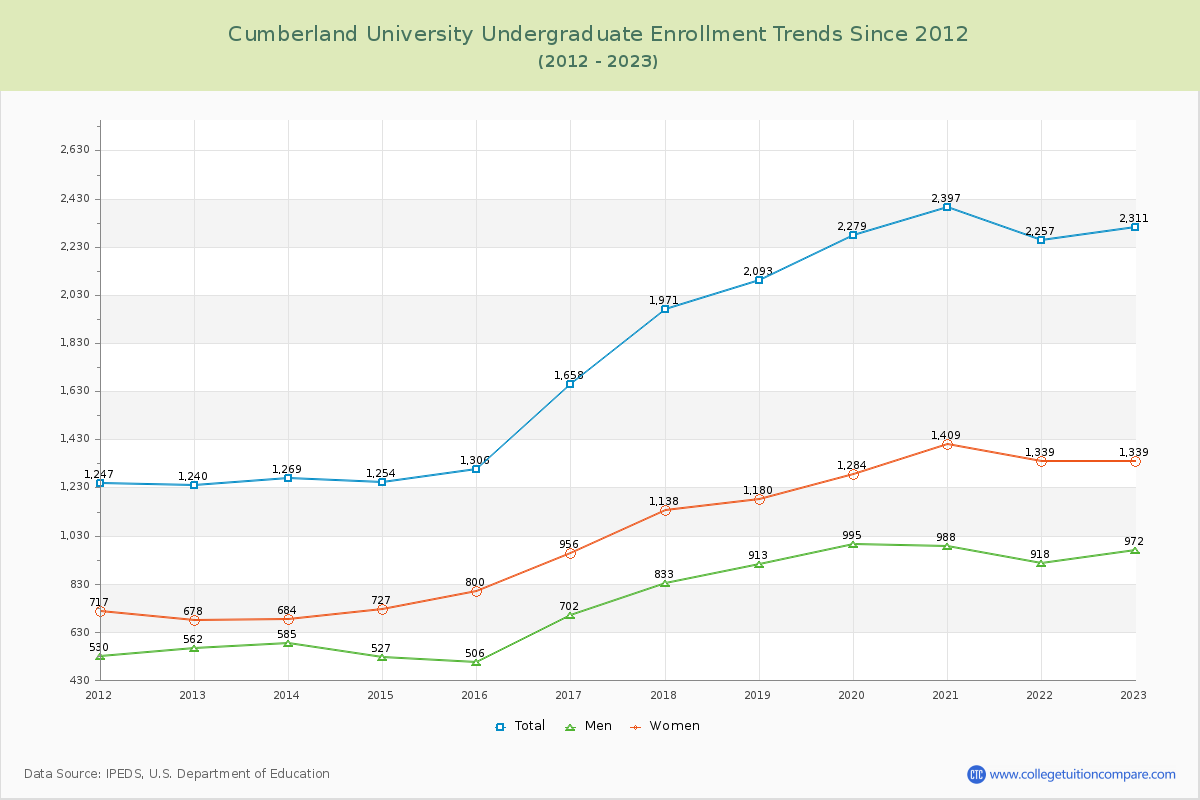
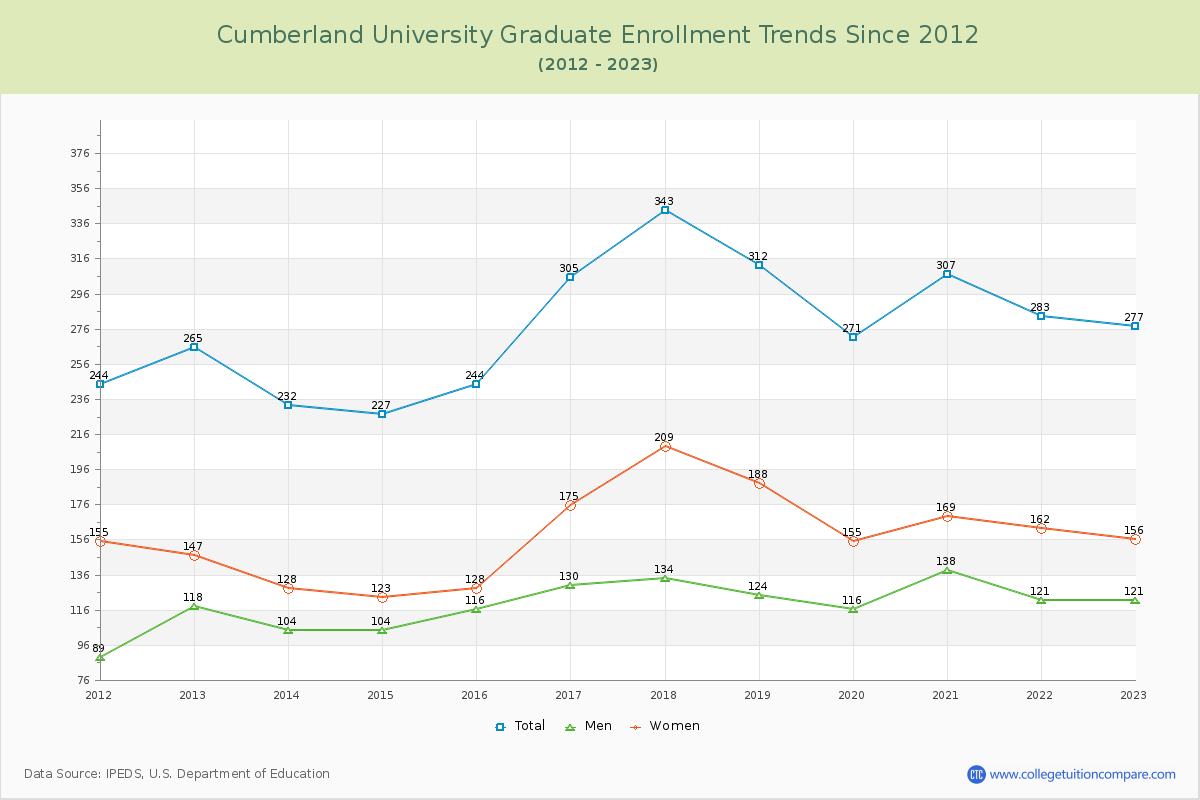
89.30% of total students is undergraduate students and 10.70% students is graduate students. The number of undergraduate students has increased by 1,071 and the graduate enrollment has increased by 12 over past 10 years.
The female to male ratio is 1.37 to 1 and it means that there are more female students enrolled in CU than male students.
The following table and chart illustrate the changes in student population by gender at Cumberland University since 2012.
| Year | Total | Undergraduate | Graduate | ||||
|---|---|---|---|---|---|---|---|
| Total | Men | Women | Total | Men | Women | ||
| 2012-13 | 1,505 | 1,240 | 562 | 678 | 265 | 118 | 147 |
| 2013-14 | 1,501 -4 | 1,269 29 | 585 23 | 684 6 | 232 -33 | 104 -14 | 128 -19 |
| 2014-15 | 1,481 -20 | 1,254 -15 | 527 -58 | 727 43 | 227 -5 | 104 0 | 123 -5 |
| 2015-16 | 1,550 69 | 1,306 52 | 506 -21 | 800 73 | 244 17 | 116 12 | 128 5 |
| 2016-17 | 1,963 413 | 1,658 352 | 702 196 | 956 156 | 305 61 | 130 14 | 175 47 |
| 2017-18 | 2,314 351 | 1,971 313 | 833 131 | 1,138 182 | 343 38 | 134 4 | 209 34 |
| 2018-19 | 2,405 91 | 2,093 122 | 913 80 | 1,180 42 | 312 -31 | 124 -10 | 188 -21 |
| 2019-20 | 2,550 145 | 2,279 186 | 995 82 | 1,284 104 | 271 -41 | 116 -8 | 155 -33 |
| 2020-21 | 2,704 154 | 2,397 118 | 988 -7 | 1,409 125 | 307 36 | 138 22 | 169 14 |
| 2021-22 | 2,540 -164 | 2,257 -140 | 918 -70 | 1,339 -70 | 283 -24 | 121 -17 | 162 -7 |
| 2022-23 | 2,588 48 | 2,311 54 | 972 54 | 1,339 0 | 277 -6 | 121 0 | 156 -6 |
| Average | 2,100 | 1,821 | 773 | 1,049 | 279 | 121 | 158 |