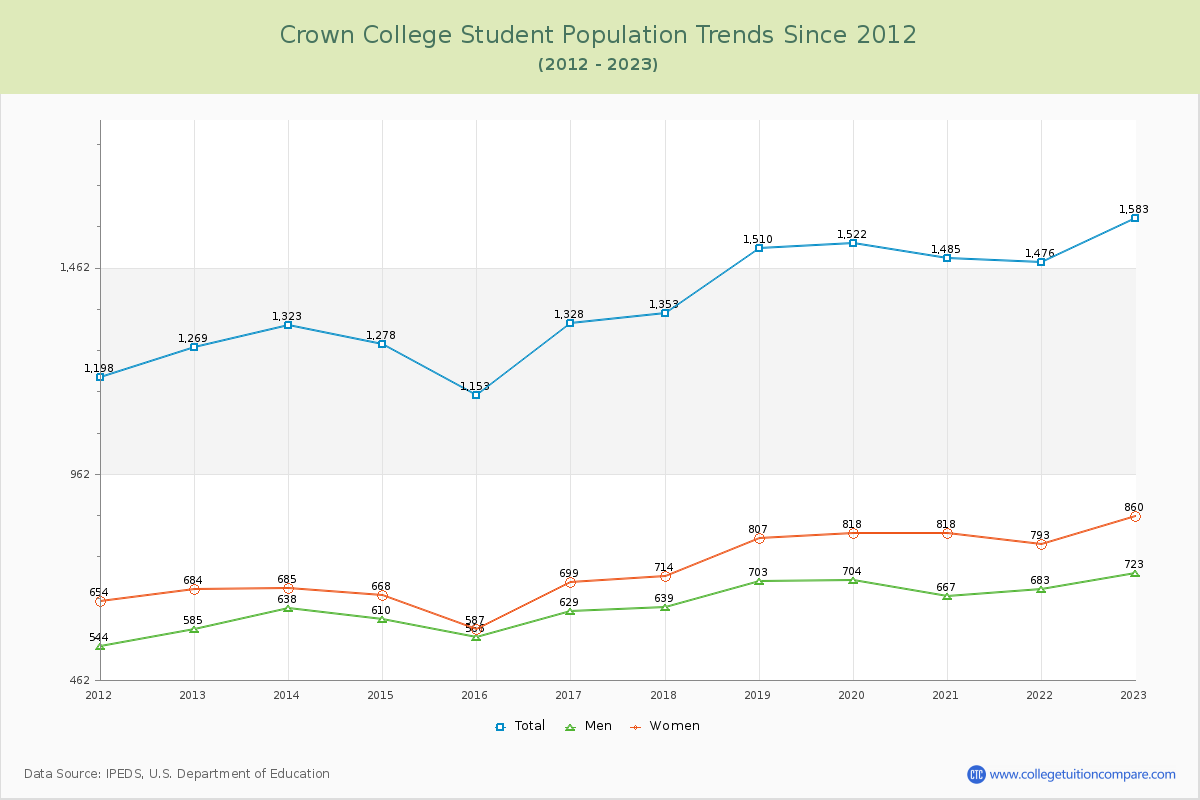
Student Population Changes
The average student population over the last 12 years is 1,389 where 1,583 students are attending the school for the academic year 2022-2023.
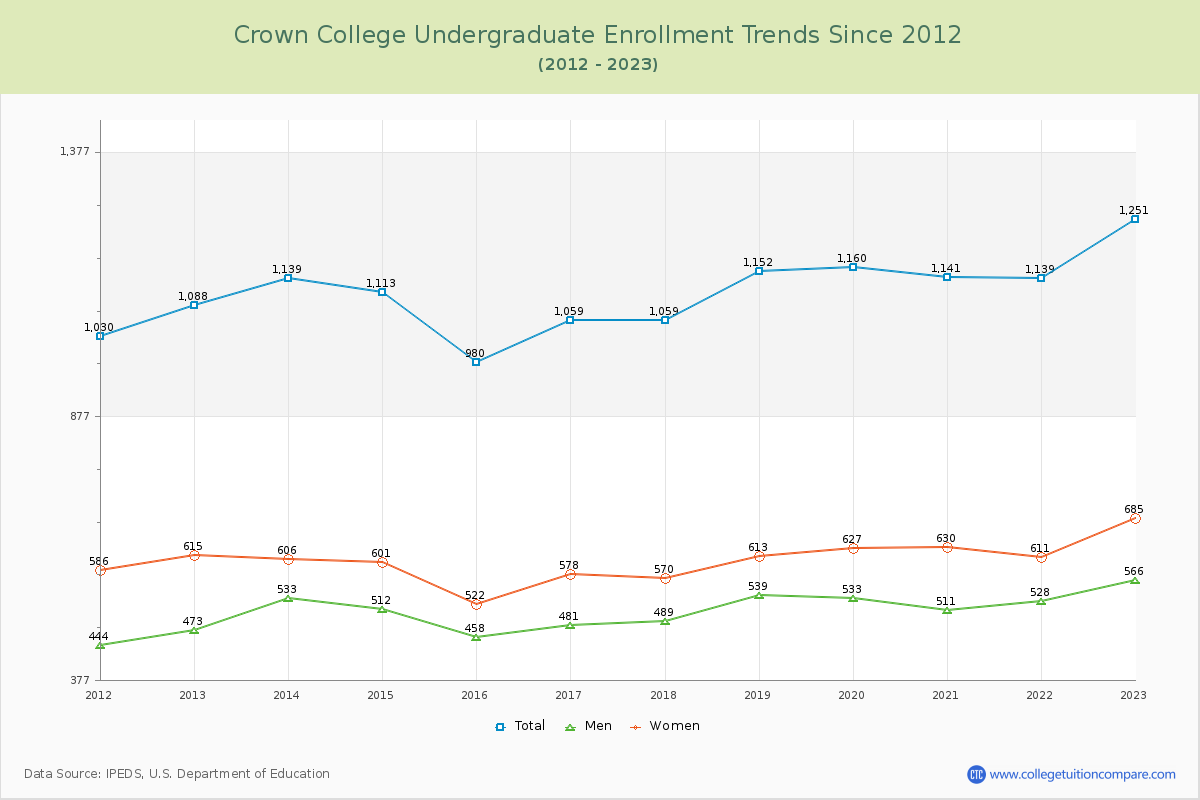
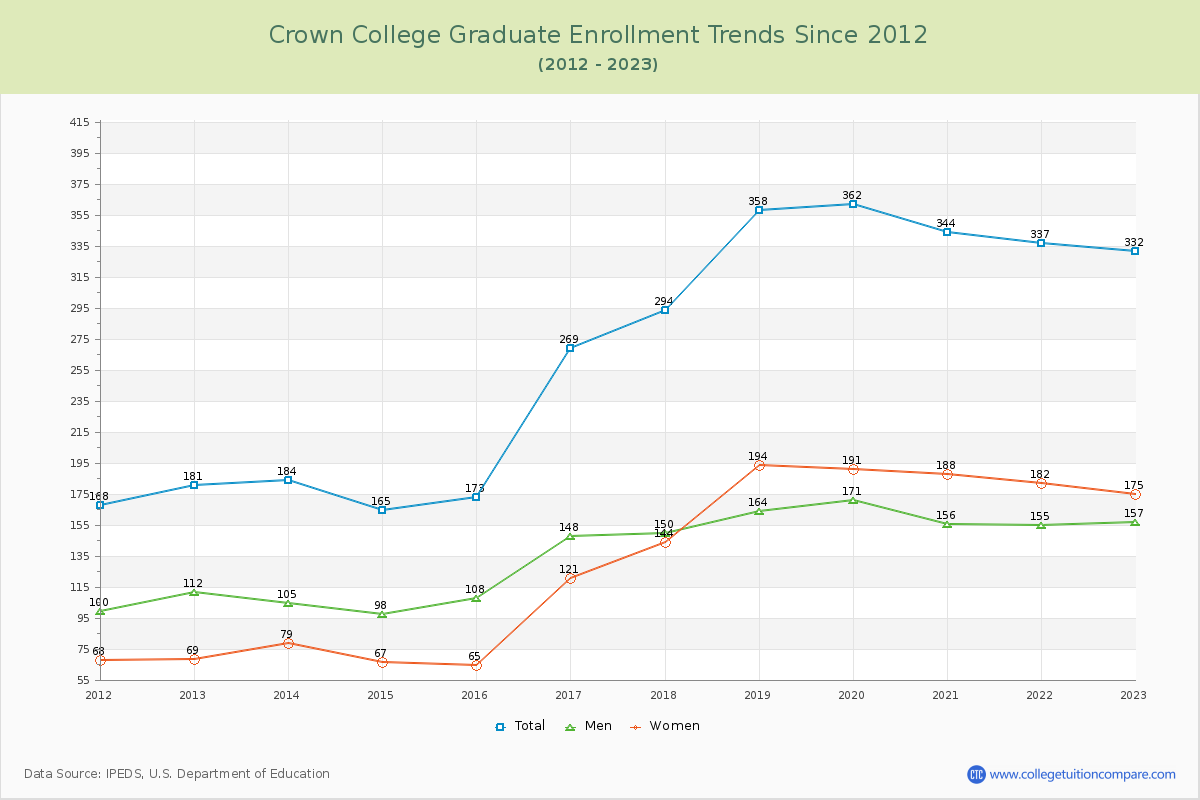
79.03% of total students is undergraduate students and 20.97% students is graduate students. The number of undergraduate students has increased by 163 and the graduate enrollment has increased by 151 over past 10 years.
The female to male ratio is 1.19 to 1 and it means that there are slightly more female students enrolled in Crown than male students.
The following table and chart illustrate the changes in student population by gender at Crown College since 2012.
| Year | Total | Undergraduate | Graduate | ||||
|---|---|---|---|---|---|---|---|
| Total | Men | Women | Total | Men | Women | ||
| 2012-13 | 1,269 | 1,088 | 473 | 615 | 181 | 112 | 69 |
| 2013-14 | 1,323 54 | 1,139 51 | 533 60 | 606 -9 | 184 3 | 105 -7 | 79 10 |
| 2014-15 | 1,278 -45 | 1,113 -26 | 512 -21 | 601 -5 | 165 -19 | 98 -7 | 67 -12 |
| 2015-16 | 1,153 -125 | 980 -133 | 458 -54 | 522 -79 | 173 8 | 108 10 | 65 -2 |
| 2016-17 | 1,328 175 | 1,059 79 | 481 23 | 578 56 | 269 96 | 148 40 | 121 56 |
| 2017-18 | 1,353 25 | 1,059 0 | 489 8 | 570 -8 | 294 25 | 150 2 | 144 23 |
| 2018-19 | 1,510 157 | 1,152 93 | 539 50 | 613 43 | 358 64 | 164 14 | 194 50 |
| 2019-20 | 1,522 12 | 1,160 8 | 533 -6 | 627 14 | 362 4 | 171 7 | 191 -3 |
| 2020-21 | 1,485 -37 | 1,141 -19 | 511 -22 | 630 3 | 344 -18 | 156 -15 | 188 -3 |
| 2021-22 | 1,476 -9 | 1,139 -2 | 528 17 | 611 -19 | 337 -7 | 155 -1 | 182 -6 |
| 2022-23 | 1,583 107 | 1,251 112 | 566 38 | 685 74 | 332 -5 | 157 2 | 175 -7 |
| Average | 1,389 | 1,116 | 511 | 605 | 273 | 139 | 134 |