Student Population Changes
The average student population over the last 12 years is 1,041 where 886 students are attending the school for the academic year 2022-2023.
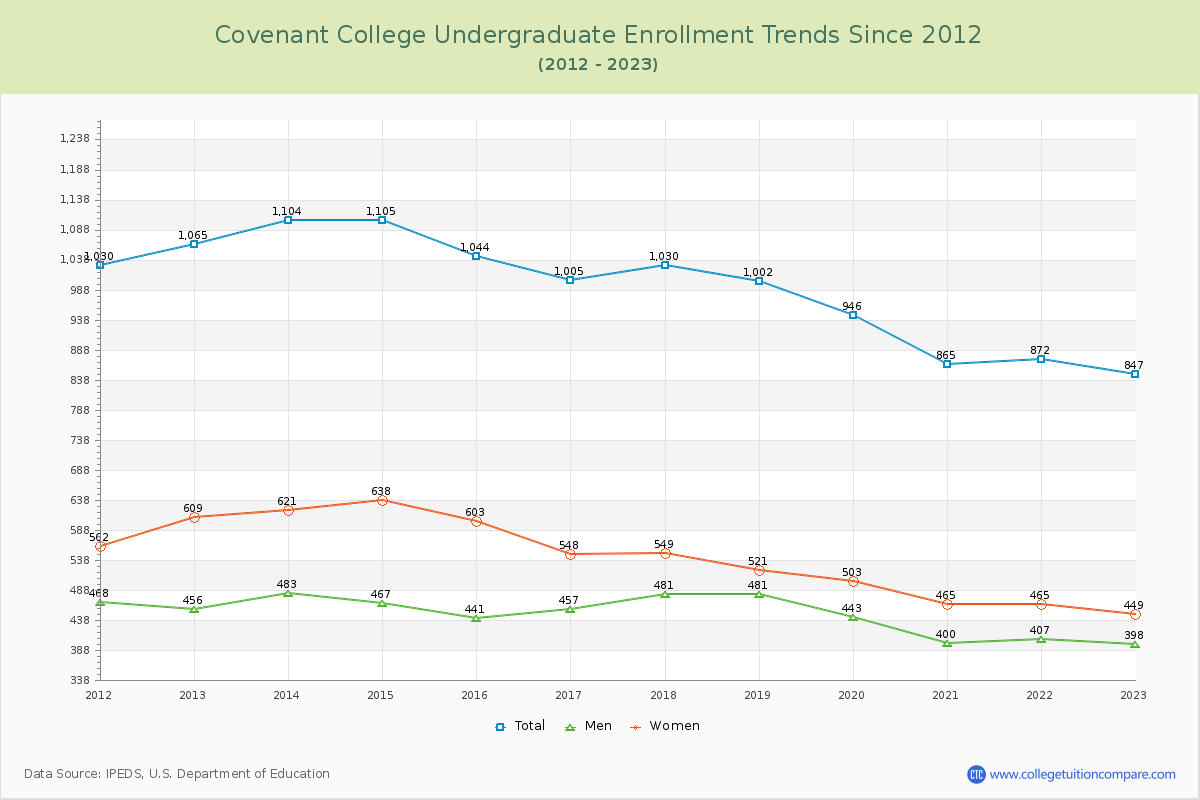
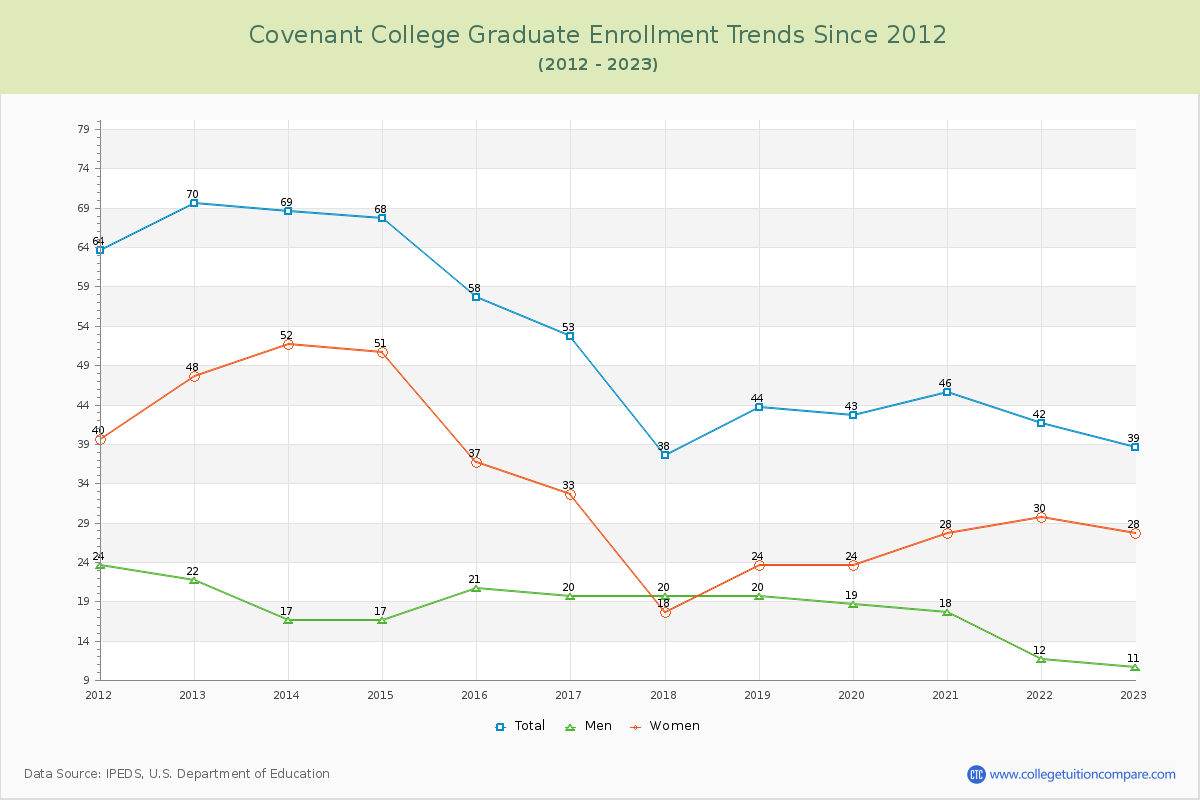
95.60% of total students is undergraduate students and 4.40% students is graduate students. The number of undergraduate students has decreased by 218 and the graduate enrollment has decreased by 31 over past 10 years.
The female to male ratio is 1.17 to 1 and it means that there are slightly more female students enrolled in Covenant than male students.
The following table and chart illustrate the changes in student population by gender at Covenant College since 2012.
| Year | Total | Undergraduate | Graduate | ||||
|---|---|---|---|---|---|---|---|
| Total | Men | Women | Total | Men | Women | ||
| 2012-13 | 1,135 | 1,065 | 456 | 609 | 70 | 22 | 48 |
| 2013-14 | 1,173 38 | 1,104 39 | 483 27 | 621 12 | 69 -1 | 17 -5 | 52 4 |
| 2014-15 | 1,173 0 | 1,105 1 | 467 -16 | 638 17 | 68 -1 | 17 0 | 51 -1 |
| 2015-16 | 1,102 -71 | 1,044 -61 | 441 -26 | 603 -35 | 58 -10 | 21 4 | 37 -14 |
| 2016-17 | 1,058 -44 | 1,005 -39 | 457 16 | 548 -55 | 53 -5 | 20 -1 | 33 -4 |
| 2017-18 | 1,068 10 | 1,030 25 | 481 24 | 549 1 | 38 -15 | 20 0 | 18 -15 |
| 2018-19 | 1,046 -22 | 1,002 -28 | 481 0 | 521 -28 | 44 6 | 20 0 | 24 6 |
| 2019-20 | 989 -57 | 946 -56 | 443 -38 | 503 -18 | 43 -1 | 19 -1 | 24 0 |
| 2020-21 | 911 -78 | 865 -81 | 400 -43 | 465 -38 | 46 3 | 18 -1 | 28 4 |
| 2021-22 | 914 3 | 872 7 | 407 7 | 465 0 | 42 -4 | 12 -6 | 30 2 |
| 2022-23 | 886 -28 | 847 -25 | 398 -9 | 449 -16 | 39 -3 | 11 -1 | 28 -2 |
| Average | 1,041 | 990 | 447 | 543 | 52 | 18 | 34 |