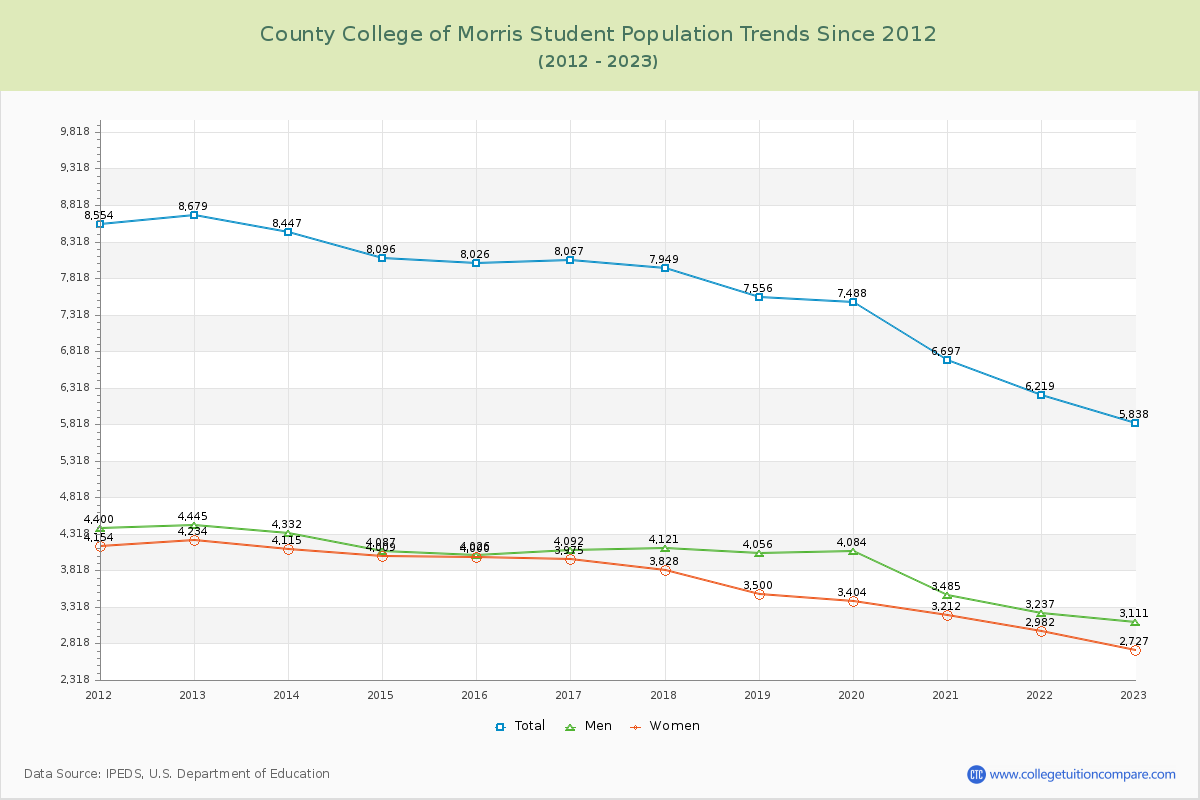
Student Population Changes
The average student population over the last 12 years is 7,551 where 5,838 students are attending the school for the academic year 2022-2023.
The female to male ratio is 0.88 to 1 and it means that there are slightly more male students enrolled in County College of Morris than female students.
The following table and chart illustrate the changes in student population by gender at County College of Morris since 2012.
| Year | Total | Men | Women |
|---|---|---|---|
| 2012-13 | 8,679 | 4,445 | 4,234 |
| 2013-14 | 8,447 -232 | 4,332 -113 | 4,115 -119 |
| 2014-15 | 8,096 -351 | 4,087 -245 | 4,009 -106 |
| 2015-16 | 8,026 -70 | 4,026 -61 | 4,000 -9 |
| 2016-17 | 8,067 41 | 4,092 66 | 3,975 -25 |
| 2017-18 | 7,949 -118 | 4,121 29 | 3,828 -147 |
| 2018-19 | 7,556 -393 | 4,056 -65 | 3,500 -328 |
| 2019-20 | 7,488 -68 | 4,084 28 | 3,404 -96 |
| 2020-21 | 6,697 -791 | 3,485 -599 | 3,212 -192 |
| 2021-22 | 6,219 -478 | 3,237 -248 | 2,982 -230 |
| 2022-23 | 5,838 -381 | 3,111 -126 | 2,727 -255 |
| Average | 7,551 | 3,916 | 3,635 |