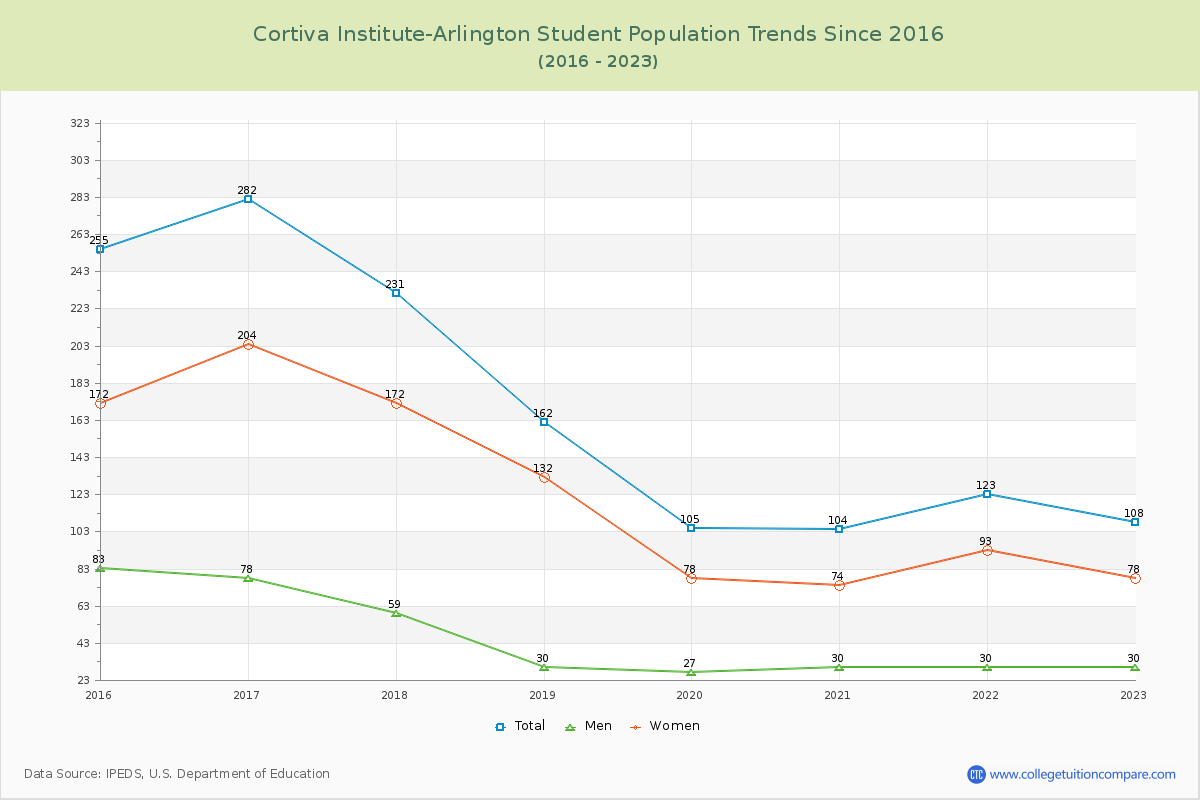
Student Population Changes
The average student population over the last 9 years is 171 where 108 students are attending the school for the academic year 2022-2023.
The female to male ratio is 2.60 to 1 and it means that there are far more female students enrolled in Cortiva Institute-Arlington than male students.
The following table and chart illustrate the changes in student population by gender at Cortiva Institute-Arlington since 2015.
| Year | Total | Men | Women |
|---|---|---|---|
| 2015-16 | 255 | 83 | 172 |
| 2016-17 | 282 27 | 78 -5 | 204 32 |
| 2017-18 | 231 -51 | 59 -19 | 172 -32 |
| 2018-19 | 162 -69 | 30 -29 | 132 -40 |
| 2019-20 | 105 -57 | 27 -3 | 78 -54 |
| 2020-21 | 104 -1 | 30 3 | 74 -4 |
| 2021-22 | 123 19 | 30 0 | 93 19 |
| 2022-23 | 108 -15 | 30 0 | 78 -15 |
| Average | 171 | 46 | 125 |