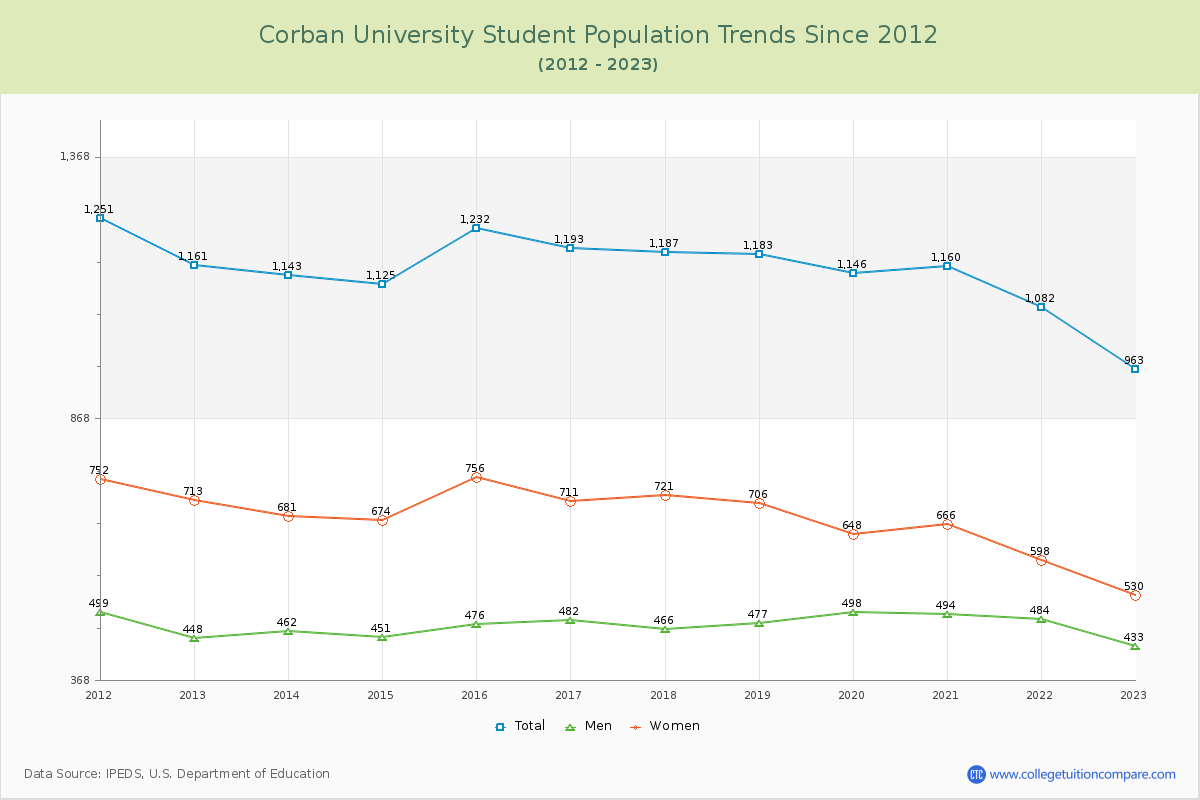
Student Population Changes
The average student population over the last 12 years is 1,143 where 963 students are attending the school for the academic year 2022-2023.
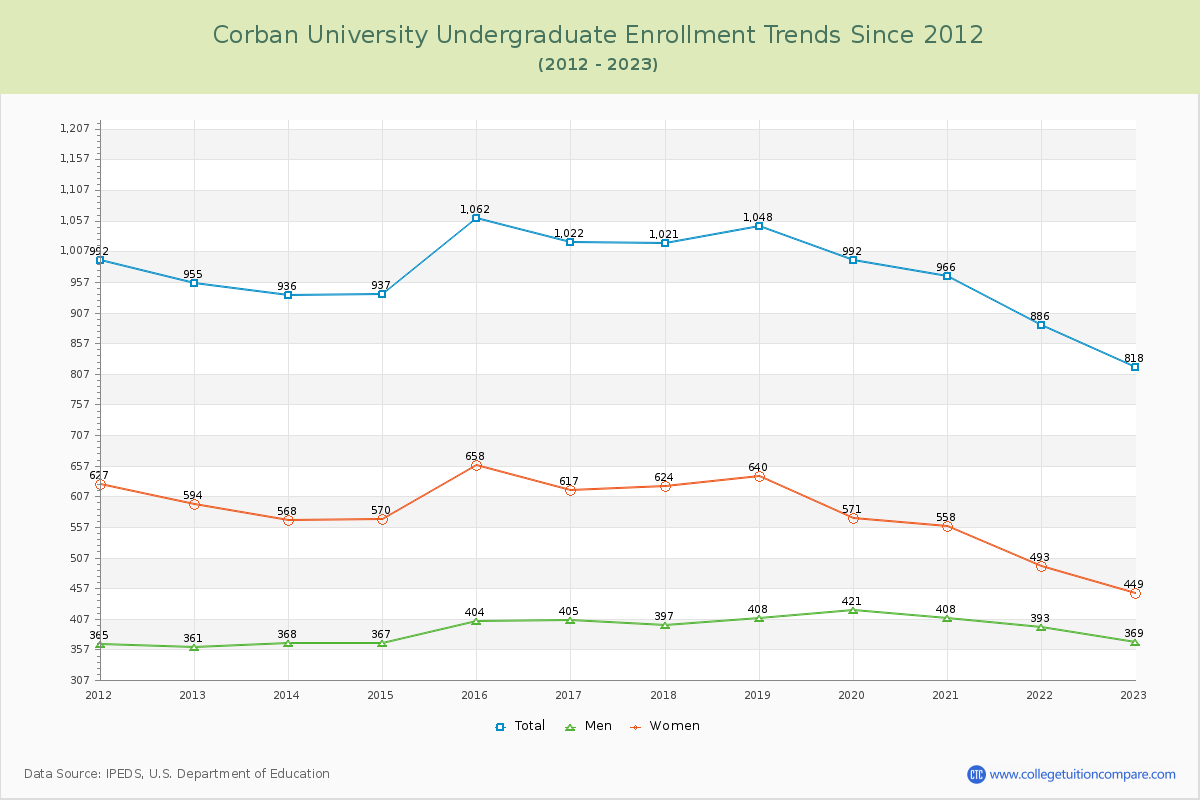
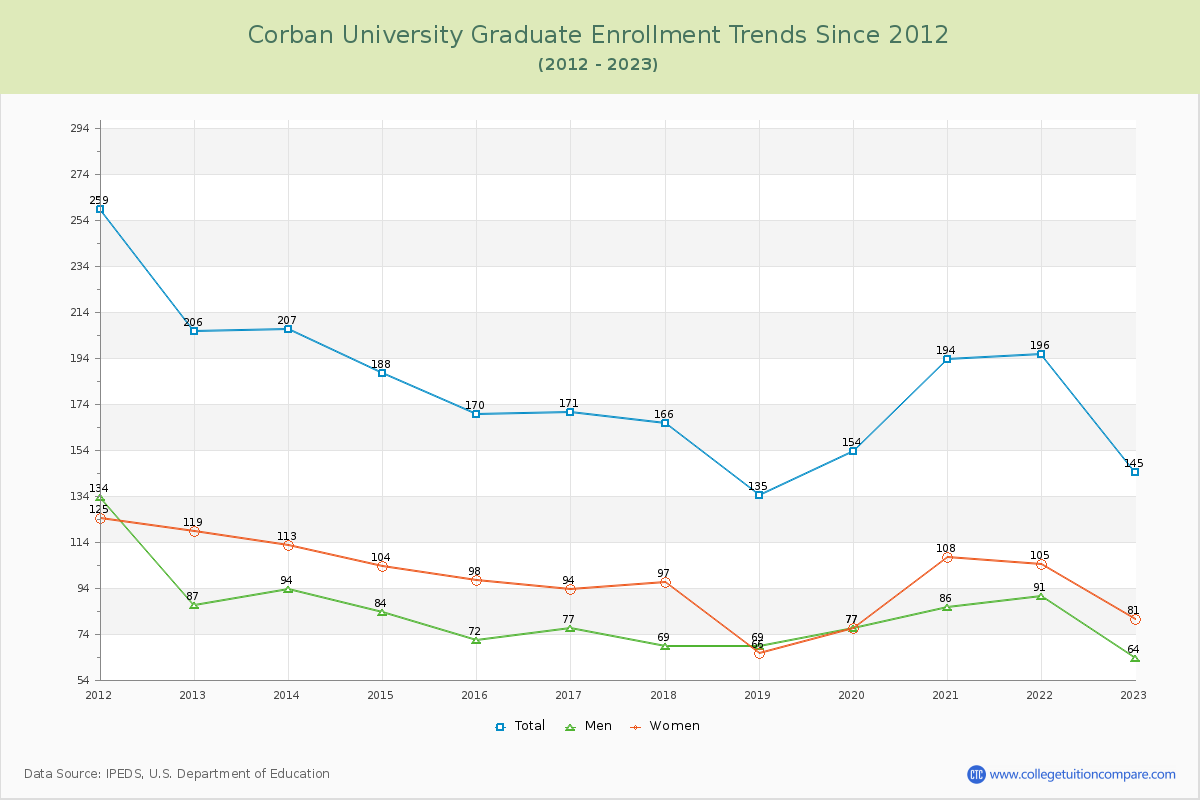
84.94% of total students is undergraduate students and 15.06% students is graduate students. The number of undergraduate students has decreased by 137 and the graduate enrollment has decreased by 61 over past 10 years.
The female to male ratio is 1.22 to 1 and it means that there are slightly more female students enrolled in Corban than male students.
The following table and chart illustrate the changes in student population by gender at Corban University since 2012.
| Year | Total | Undergraduate | Graduate | ||||
|---|---|---|---|---|---|---|---|
| Total | Men | Women | Total | Men | Women | ||
| 2012-13 | 1,161 | 955 | 361 | 594 | 206 | 87 | 119 |
| 2013-14 | 1,143 -18 | 936 -19 | 368 7 | 568 -26 | 207 1 | 94 7 | 113 -6 |
| 2014-15 | 1,125 -18 | 937 1 | 367 -1 | 570 2 | 188 -19 | 84 -10 | 104 -9 |
| 2015-16 | 1,232 107 | 1,062 125 | 404 37 | 658 88 | 170 -18 | 72 -12 | 98 -6 |
| 2016-17 | 1,193 -39 | 1,022 -40 | 405 1 | 617 -41 | 171 1 | 77 5 | 94 -4 |
| 2017-18 | 1,187 -6 | 1,021 -1 | 397 -8 | 624 7 | 166 -5 | 69 -8 | 97 3 |
| 2018-19 | 1,183 -4 | 1,048 27 | 408 11 | 640 16 | 135 -31 | 69 0 | 66 -31 |
| 2019-20 | 1,146 -37 | 992 -56 | 421 13 | 571 -69 | 154 19 | 77 8 | 77 11 |
| 2020-21 | 1,160 14 | 966 -26 | 408 -13 | 558 -13 | 194 40 | 86 9 | 108 31 |
| 2021-22 | 1,082 -78 | 886 -80 | 393 -15 | 493 -65 | 196 2 | 91 5 | 105 -3 |
| 2022-23 | 963 -119 | 818 -68 | 369 -24 | 449 -44 | 145 -51 | 64 -27 | 81 -24 |
| Average | 1,143 | 968 | 391 | 577 | 176 | 79 | 97 |