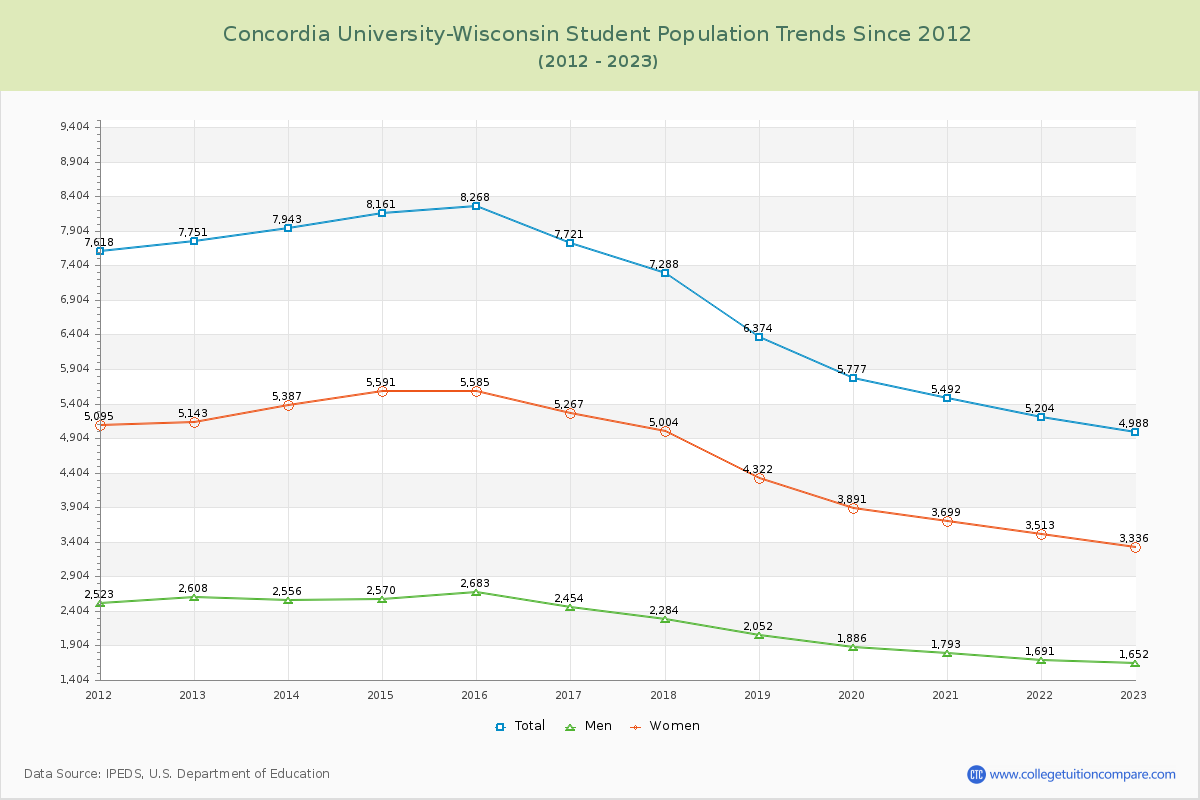
Student Population Changes
The average student population over the last 12 years is 6,815 where 4,988 students are attending the school for the academic year 2022-2023.
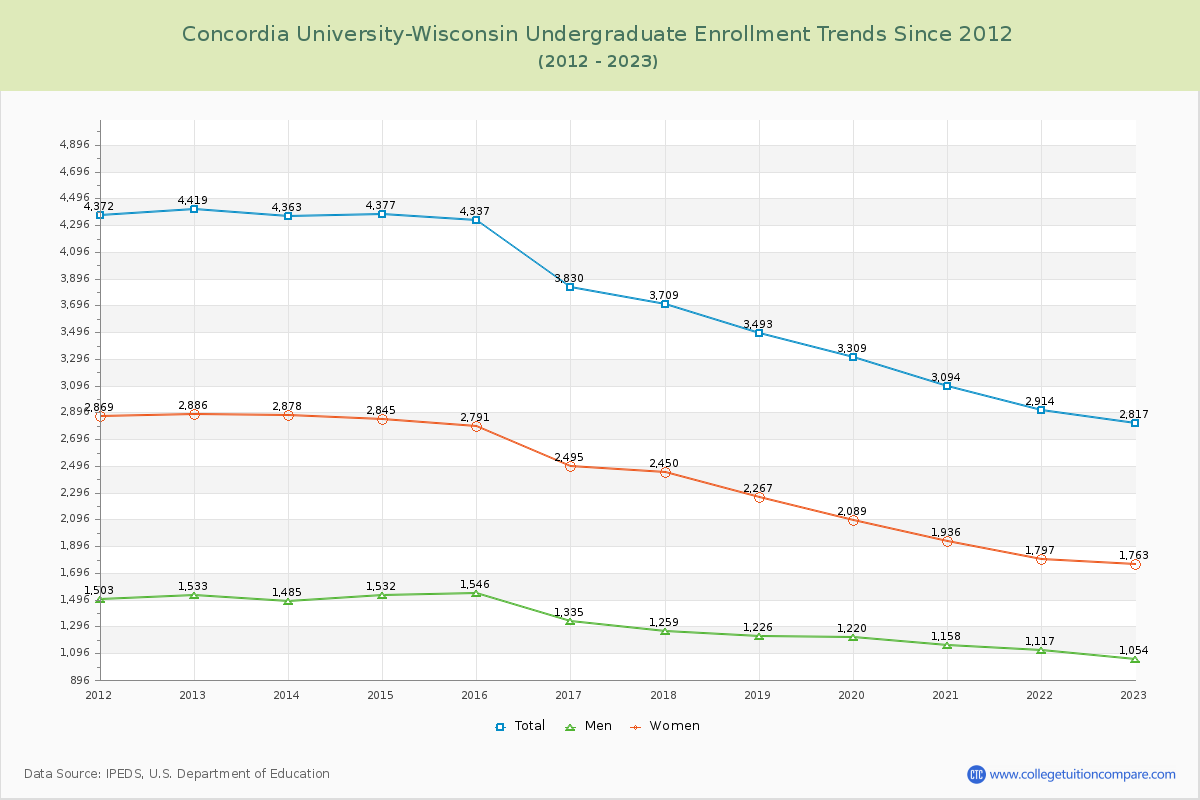
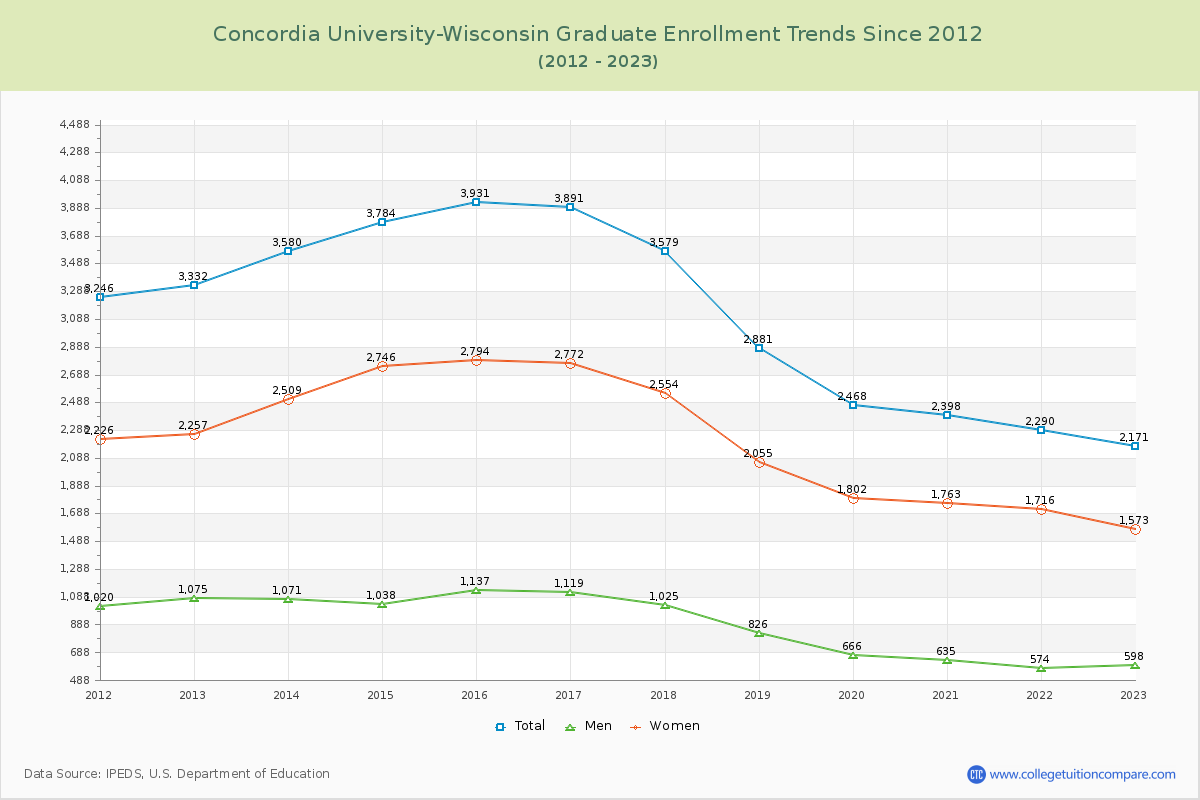
56.48% of total students is undergraduate students and 43.52% students is graduate students. The number of undergraduate students has decreased by 1,602 and the graduate enrollment has decreased by 1,161 over past 10 years.
The female to male ratio is 2.02 to 1 and it means that there are far more female students enrolled in CUW than male students.
The following table and chart illustrate the changes in student population by gender at Concordia University-Wisconsin since 2012.
| Year | Total | Undergraduate | Graduate | ||||
|---|---|---|---|---|---|---|---|
| Total | Men | Women | Total | Men | Women | ||
| 2012-13 | 7,751 | 4,419 | 1,533 | 2,886 | 3,332 | 1,075 | 2,257 |
| 2013-14 | 7,943 192 | 4,363 -56 | 1,485 -48 | 2,878 -8 | 3,580 248 | 1,071 -4 | 2,509 252 |
| 2014-15 | 8,161 218 | 4,377 14 | 1,532 47 | 2,845 -33 | 3,784 204 | 1,038 -33 | 2,746 237 |
| 2015-16 | 8,268 107 | 4,337 -40 | 1,546 14 | 2,791 -54 | 3,931 147 | 1,137 99 | 2,794 48 |
| 2016-17 | 7,721 -547 | 3,830 -507 | 1,335 -211 | 2,495 -296 | 3,891 -40 | 1,119 -18 | 2,772 -22 |
| 2017-18 | 7,288 -433 | 3,709 -121 | 1,259 -76 | 2,450 -45 | 3,579 -312 | 1,025 -94 | 2,554 -218 |
| 2018-19 | 6,374 -914 | 3,493 -216 | 1,226 -33 | 2,267 -183 | 2,881 -698 | 826 -199 | 2,055 -499 |
| 2019-20 | 5,777 -597 | 3,309 -184 | 1,220 -6 | 2,089 -178 | 2,468 -413 | 666 -160 | 1,802 -253 |
| 2020-21 | 5,492 -285 | 3,094 -215 | 1,158 -62 | 1,936 -153 | 2,398 -70 | 635 -31 | 1,763 -39 |
| 2021-22 | 5,204 -288 | 2,914 -180 | 1,117 -41 | 1,797 -139 | 2,290 -108 | 574 -61 | 1,716 -47 |
| 2022-23 | 4,988 -216 | 2,817 -97 | 1,054 -63 | 1,763 -34 | 2,171 -119 | 598 24 | 1,573 -143 |
| Average | 6,815 | 3,697 | 1,315 | 2,382 | 3,119 | 888 | 2,231 |