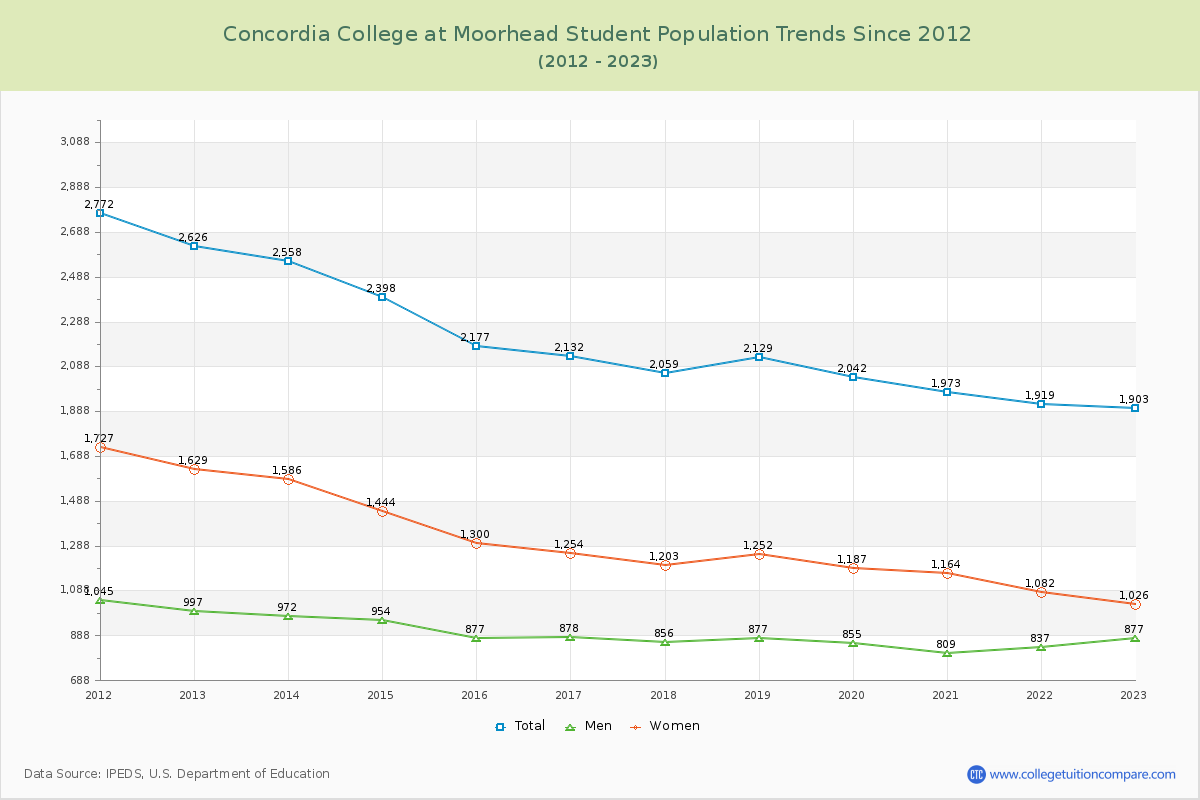
Student Population Changes
The average student population over the last 12 years is 2,174 where 1,903 students are attending the school for the academic year 2022-2023.
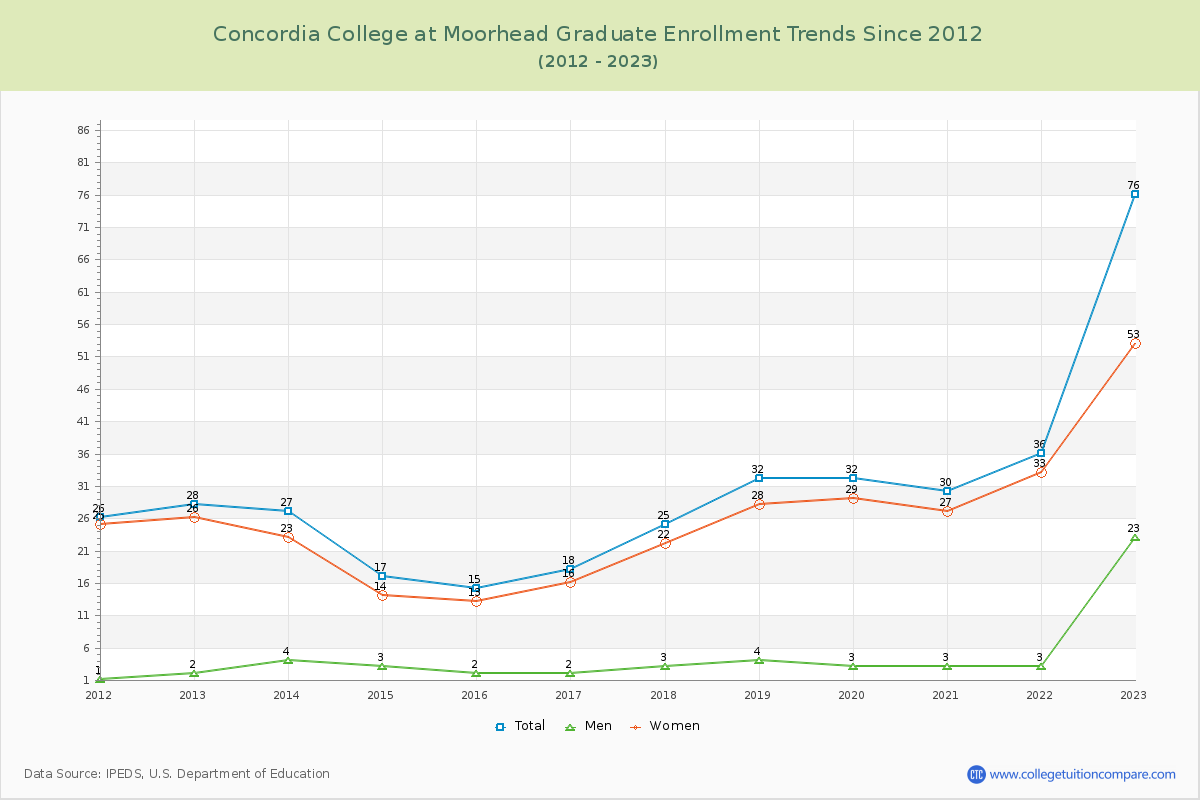
96.01% of total students is undergraduate students and 3.99% students is graduate students. The number of undergraduate students has decreased by 771 and the graduate enrollment has increased by 48 over past 10 years.
The female to male ratio is 1.17 to 1 and it means that there are slightly more female students enrolled in Concordia College at Moorhead than male students.
The following table and chart illustrate the changes in student population by gender at Concordia College at Moorhead since 2012.
| Year | Total | Undergraduate | Graduate | ||||
|---|---|---|---|---|---|---|---|
| Total | Men | Women | Total | Men | Women | ||
| 2012-13 | 2,626 | 2,598 | 995 | 1,603 | 28 | 2 | 26 |
| 2013-14 | 2,558 -68 | 2,531 -67 | 968 -27 | 1,563 -40 | 27 -1 | 4 2 | 23 -3 |
| 2014-15 | 2,398 -160 | 2,381 -150 | 951 -17 | 1,430 -133 | 17 -10 | 3 -1 | 14 -9 |
| 2015-16 | 2,177 -221 | 2,162 -219 | 875 -76 | 1,287 -143 | 15 -2 | 2 -1 | 13 -1 |
| 2016-17 | 2,132 -45 | 2,114 -48 | 876 1 | 1,238 -49 | 18 3 | 2 0 | 16 3 |
| 2017-18 | 2,059 -73 | 2,034 -80 | 853 -23 | 1,181 -57 | 25 7 | 3 1 | 22 6 |
| 2018-19 | 2,129 70 | 2,097 63 | 873 20 | 1,224 43 | 32 7 | 4 1 | 28 6 |
| 2019-20 | 2,042 -87 | 2,010 -87 | 852 -21 | 1,158 -66 | 32 0 | 3 -1 | 29 1 |
| 2020-21 | 1,973 -69 | 1,943 -67 | 806 -46 | 1,137 -21 | 30 -2 | 3 0 | 27 -2 |
| 2021-22 | 1,919 -54 | 1,883 -60 | 834 28 | 1,049 -88 | 36 6 | 3 0 | 33 6 |
| 2022-23 | 1,903 -16 | 1,827 -56 | 854 20 | 973 -76 | 76 40 | 23 20 | 53 20 |
| Average | 2,174 | 2,144 | 885 | 1,258 | 31 | 5 | 26 |