Enrollment Trends at Columbia Gorge CC

-83

Total Enrollment

-41

Men

-42

Women

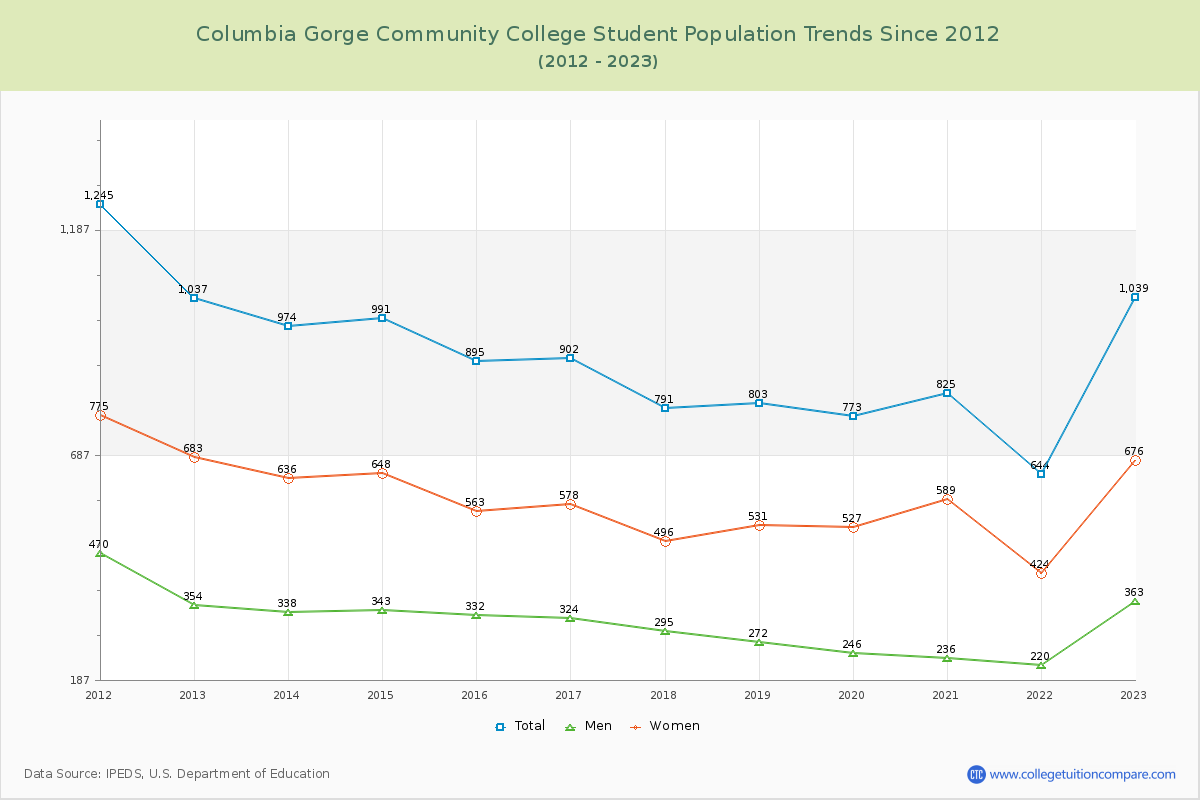
The student population at Columbia Gorge Community College is 812 (all undergraduate). The number of students has decreased by 83 over the past decade.

The female to male ratio is 1.79 to 1 which means that female students enrolled more than male students.

200 students enrolled in online degree program exclusively and the number of online students has increased by 73.91% since 2015.

Student Population Changes

The average student population over the last 11 years is 822 where 812 students are attending the school for the academic year 2024-2025.

The female to male ratio is 1.79 to 1 and it means that there are more female students enrolled in Columbia Gorge CC than male students.

The following table and chart illustrate the changes in student population by gender at Columbia Gorge Community College since 2015.

YearTotalMenWomen
2015-16895332563
2016-17902
7
324
-8
578
15
2017-18791
-111
295
-29
496
-82
2018-19803
12
272
-23
531
35
2019-20773
-30
246
-26
527
-4
2020-21825
52
236
-10
589
62
2021-22644
-181
220
-16
424
-165
2022-231,039
395
363
143
676
252
2023-24736
-303
262
-101
474
-202
2024-25812
76
291
29
521
47
Average822284538
Columbia Gorge Community College Enrollment Trends Chart

Enrollment by Race/Ethnicity Changes

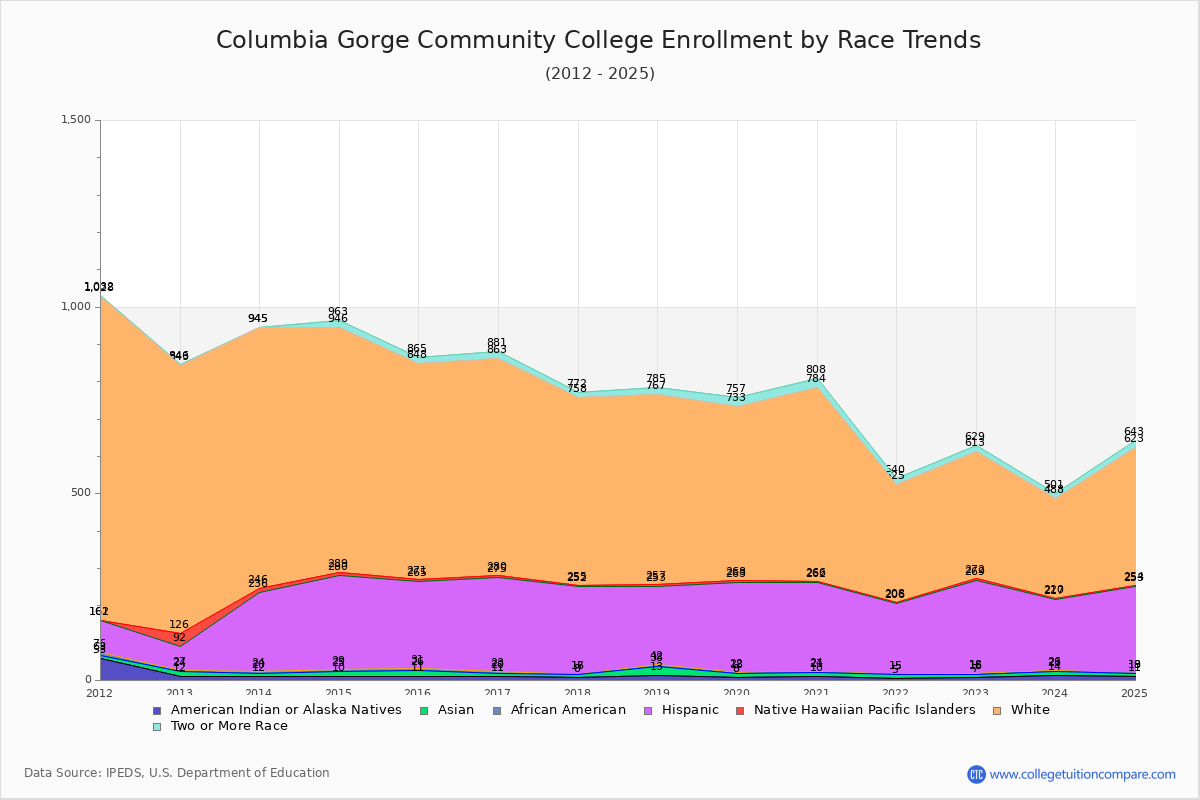
The percentage of white students is 45.44% and the percentage of black students is 0.12% at Columbia Gorge Community College. 0.86% of enrolled students is Asian. Hispanic students comprise 28.82% of the student body.

Over the past 10 years, the racial composition has shifted. The percentage of white students decreased from 64.47% to 45.44%. Asian enrollment declined from 1.68% to 0.86%. Black student enrollment decreased from 0.56% to 0.12%. Hispanic student representation expanded from 26.15% to 28.82%.

The overall racial diversity, measured by the Census Bureau Diversity Index, is 0.7096 which indicates that quite diverse. This increased from 0.5151 a decade ago, suggesting that racial diversity has improved.

The following table and chart illustrate the student population trends by race/ethnicity at Columbia Gorge Community College over the past 11 years (2015-2025).

YearAmerican Indian or Native AmericanAsianBlackHispanicNative Hawaiian or Other Pacific IslanderWhiteTwo or More Races
2015-1611155234657717
2016-171193252558318
2017-18881235350314
2018-1913254211451018
2019-208104241546524
2020-2110113238451824
2021-225100191231715
2022-23792251334116
2023-241493191326813
2024-251171234136920
Average10113228444518
Columbia Gorge Community College Enrollment by Race Trends Chart

Distance Learning (Online Courses) Enrollment Changes

200 students are enrolled in online degree programs exclusively for the academic year 2024-2025, which is 25% of total students. The number of online students has increased 73.91% since 2015. The following table and chart illustrate the changes in the online student population by enrolled type at Columbia Gorge Community College from 2015 to 2025.

YearTotal EnrollmentOnline CompletelyEnrolled in Some Online CoursesNot Enrolled in Online Courses
2015-16895115331449
2016-17902135370397
2017-18791141373277
2018-19803148366289
2019-20773164373236
2020-21825241387197
2021-22644119209316
2022-231,039136221682
2023-24736166210360
2024-25812200201411
Average822157304361

Ratings & Review

Share your experiences and thoughts about Columbia Gorge Community College. It will be a great help to applicants and prospective students!