Student Population Changes
The average student population over the last 12 years is 17,184 where 24,808 students are attending the school for the academic year 2022-2023.
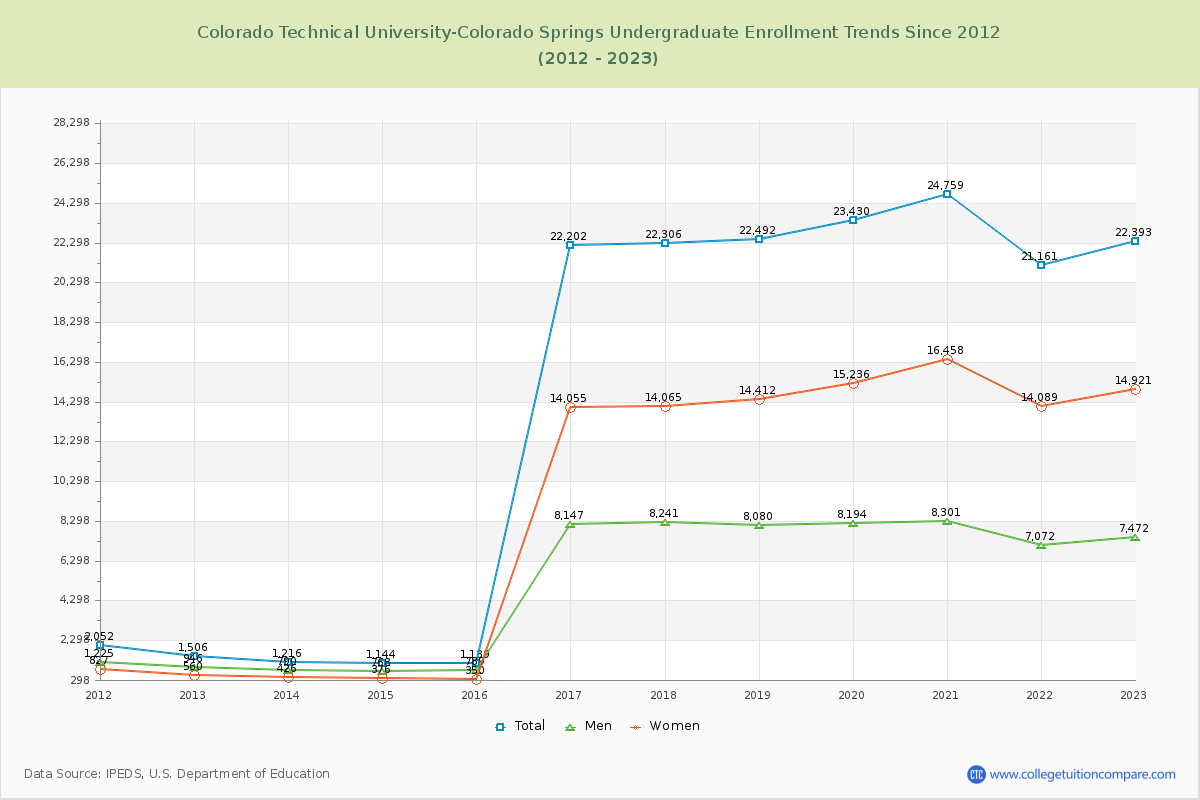
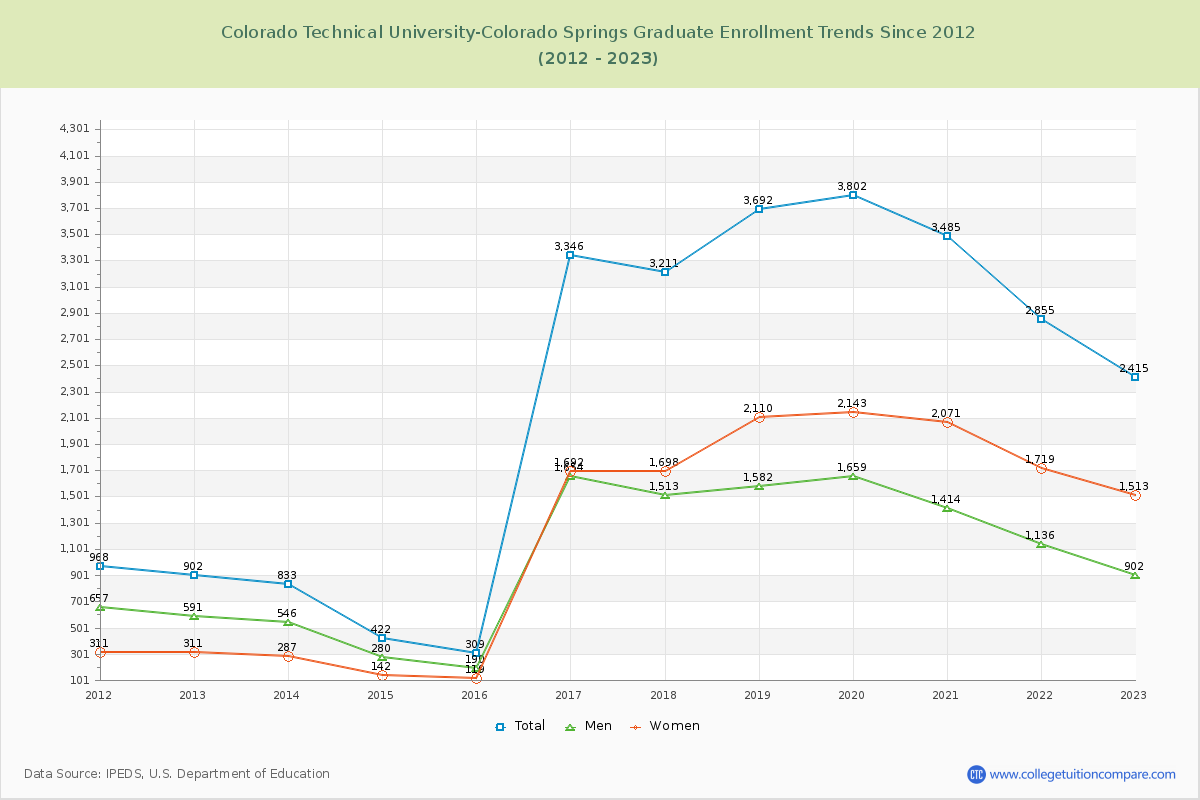
90.27% of total students is undergraduate students and 9.73% students is graduate students. The number of undergraduate students has increased by 20,887 and the graduate enrollment has increased by 1,513 over past 10 years.
The female to male ratio is 1.96 to 1 and it means that there are more female students enrolled in CTU than male students.
The following table and chart illustrate the changes in student population by gender at Colorado Technical University-Colorado Springs since 2012.
| Year | Total | Undergraduate | Graduate | ||||
|---|---|---|---|---|---|---|---|
| Total | Men | Women | Total | Men | Women | ||
| 2012-13 | 2,408 | 1,506 | 946 | 560 | 902 | 591 | 311 |
| 2013-14 | 2,049 -359 | 1,216 -290 | 790 -156 | 426 -134 | 833 -69 | 546 -45 | 287 -24 |
| 2014-15 | 1,566 -483 | 1,144 -72 | 768 -22 | 376 -50 | 422 -411 | 280 -266 | 142 -145 |
| 2015-16 | 1,448 -118 | 1,139 -5 | 789 21 | 350 -26 | 309 -113 | 190 -90 | 119 -23 |
| 2016-17 | 25,548 24,100 | 22,202 21,063 | 8,147 7,358 | 14,055 13,705 | 3,346 3,037 | 1,654 1,464 | 1,692 1,573 |
| 2017-18 | 25,517 -31 | 22,306 104 | 8,241 94 | 14,065 10 | 3,211 -135 | 1,513 -141 | 1,698 6 |
| 2018-19 | 26,184 667 | 22,492 186 | 8,080 -161 | 14,412 347 | 3,692 481 | 1,582 69 | 2,110 412 |
| 2019-20 | 27,232 1,048 | 23,430 938 | 8,194 114 | 15,236 824 | 3,802 110 | 1,659 77 | 2,143 33 |
| 2020-21 | 28,244 1,012 | 24,759 1,329 | 8,301 107 | 16,458 1,222 | 3,485 -317 | 1,414 -245 | 2,071 -72 |
| 2021-22 | 24,016 -4,228 | 21,161 -3,598 | 7,072 -1,229 | 14,089 -2,369 | 2,855 -630 | 1,136 -278 | 1,719 -352 |
| 2022-23 | 24,808 792 | 22,393 1,232 | 7,472 400 | 14,921 832 | 2,415 -440 | 902 -234 | 1,513 -206 |
| Average | 17,184 | 14,886 | 5,345 | 9,541 | 2,297 | 1,042 | 1,255 |