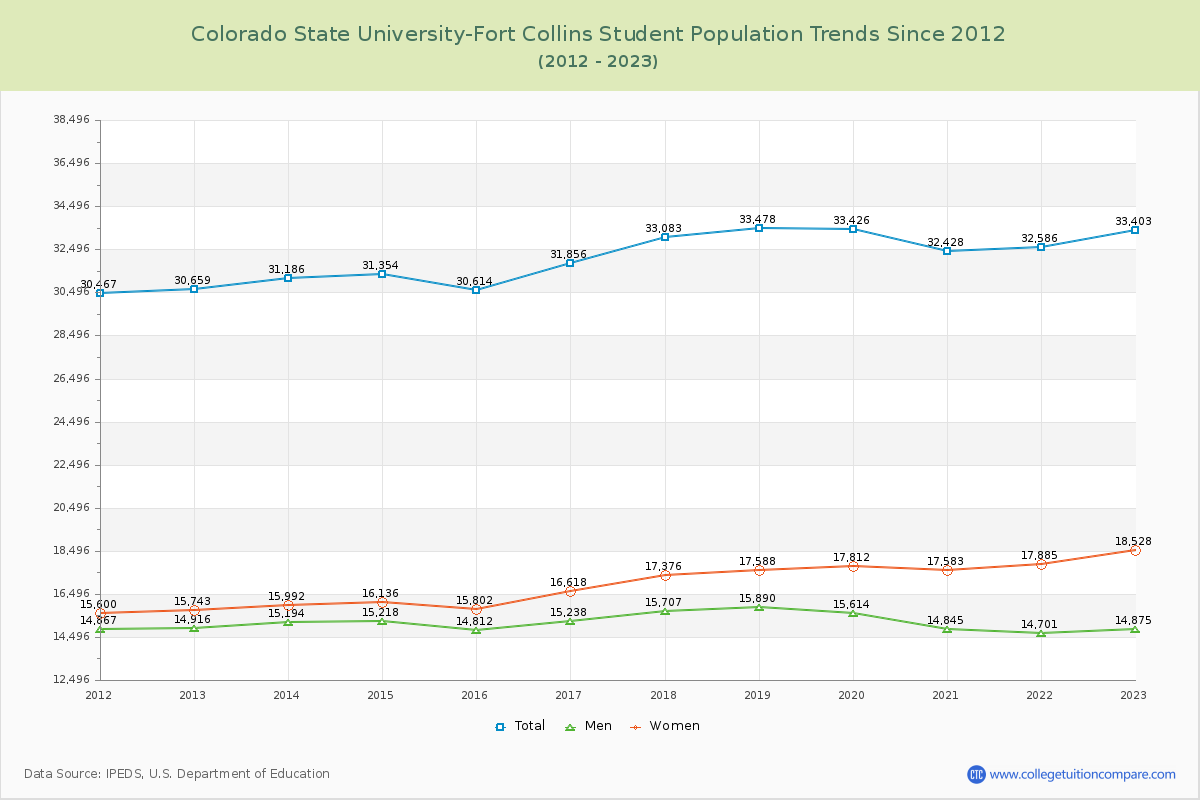
Student Population Changes
The average student population over the last 12 years is 32,188 where 33,403 students are attending the school for the academic year 2022-2023.
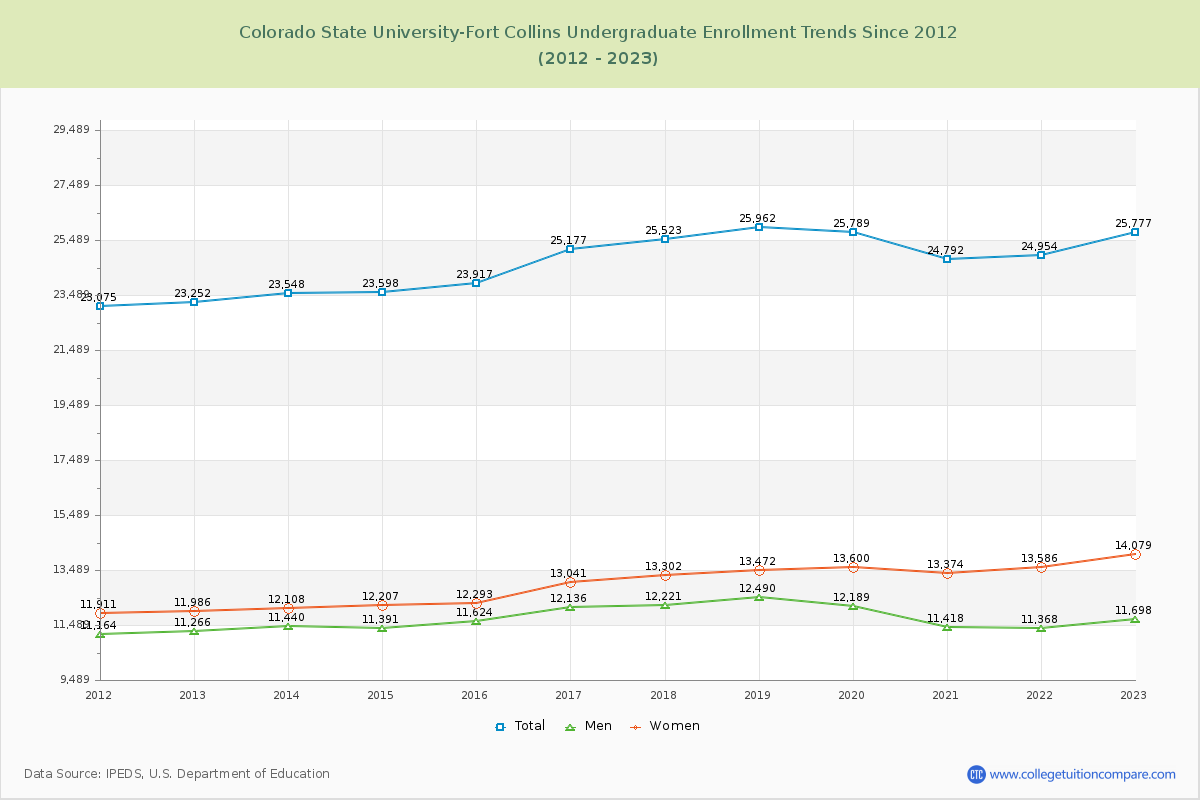
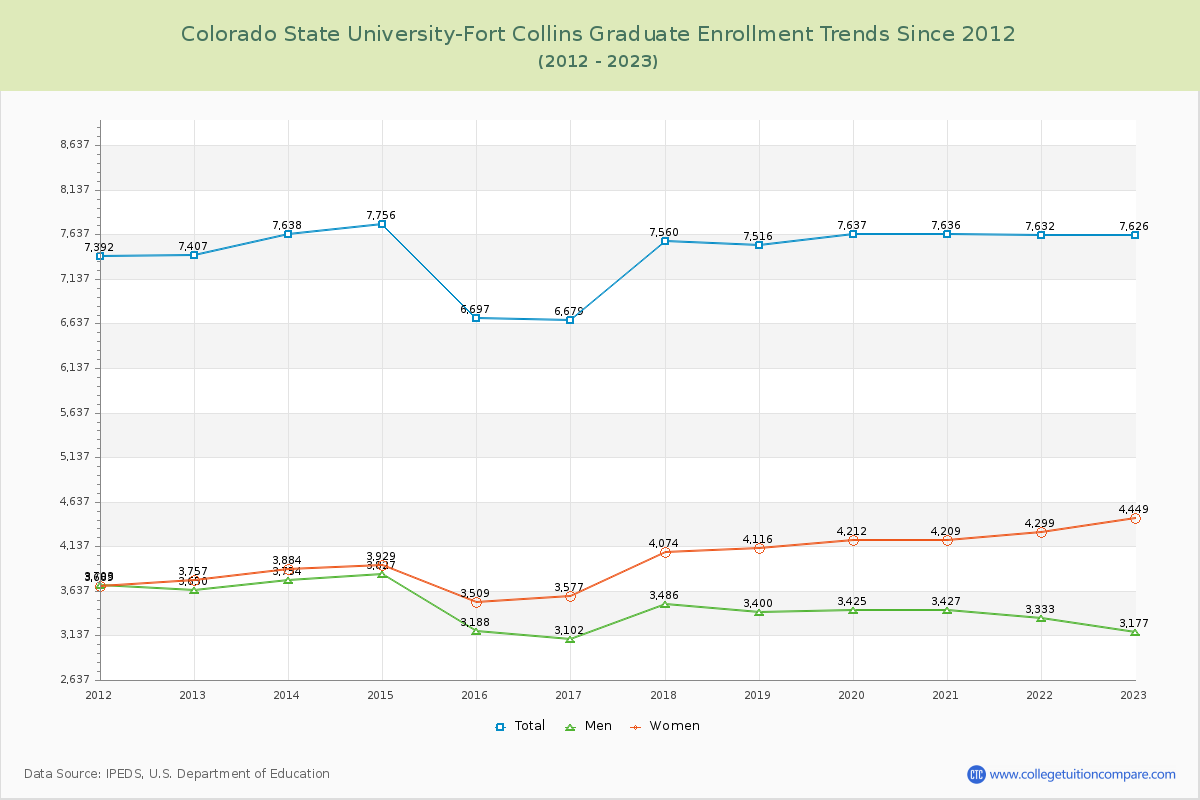
77.17% of total students is undergraduate students and 22.83% students is graduate students. The number of undergraduate students has increased by 2,525 and the graduate enrollment has increased by 219 over past 10 years.
The female to male ratio is 1.25 to 1 and it means that there are slightly more female students enrolled in Colorado State University-Fort Collins than male students.
The following table and chart illustrate the changes in student population by gender at Colorado State University-Fort Collins since 2012.
| Year | Total | Undergraduate | Graduate | ||||
|---|---|---|---|---|---|---|---|
| Total | Men | Women | Total | Men | Women | ||
| 2012-13 | 30,659 | 23,252 | 11,266 | 11,986 | 7,407 | 3,650 | 3,757 |
| 2013-14 | 31,186 527 | 23,548 296 | 11,440 174 | 12,108 122 | 7,638 231 | 3,754 104 | 3,884 127 |
| 2014-15 | 31,354 168 | 23,598 50 | 11,391 -49 | 12,207 99 | 7,756 118 | 3,827 73 | 3,929 45 |
| 2015-16 | 30,614 -740 | 23,917 319 | 11,624 233 | 12,293 86 | 6,697 -1,059 | 3,188 -639 | 3,509 -420 |
| 2016-17 | 31,856 1,242 | 25,177 1,260 | 12,136 512 | 13,041 748 | 6,679 -18 | 3,102 -86 | 3,577 68 |
| 2017-18 | 33,083 1,227 | 25,523 346 | 12,221 85 | 13,302 261 | 7,560 881 | 3,486 384 | 4,074 497 |
| 2018-19 | 33,478 395 | 25,962 439 | 12,490 269 | 13,472 170 | 7,516 -44 | 3,400 -86 | 4,116 42 |
| 2019-20 | 33,426 -52 | 25,789 -173 | 12,189 -301 | 13,600 128 | 7,637 121 | 3,425 25 | 4,212 96 |
| 2020-21 | 32,428 -998 | 24,792 -997 | 11,418 -771 | 13,374 -226 | 7,636 -1 | 3,427 2 | 4,209 -3 |
| 2021-22 | 32,586 158 | 24,954 162 | 11,368 -50 | 13,586 212 | 7,632 -4 | 3,333 -94 | 4,299 90 |
| 2022-23 | 33,403 817 | 25,777 823 | 11,698 330 | 14,079 493 | 7,626 -6 | 3,177 -156 | 4,449 150 |
| Average | 32,188 | 24,754 | 11,749 | 13,004 | 7,435 | 3,434 | 4,001 |