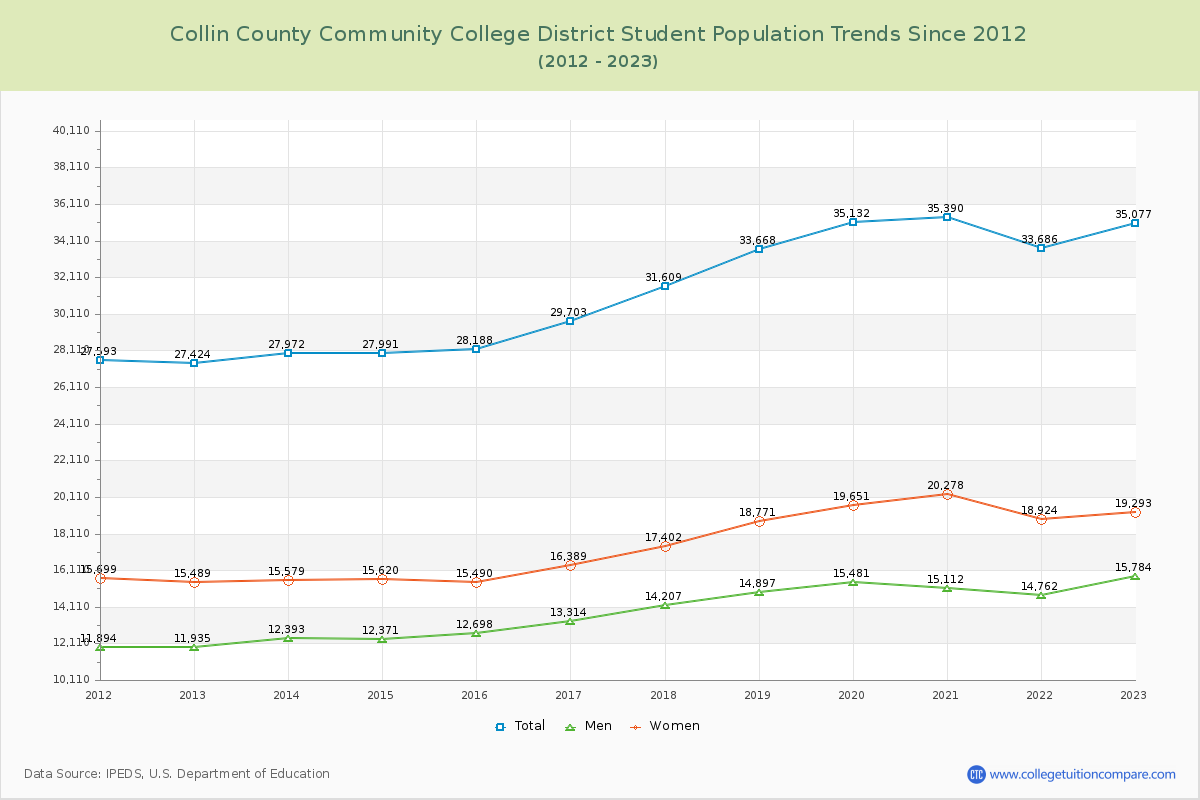
Student Population Changes
The average student population over the last 12 years is 31,440 where 35,077 students are attending the school for the academic year 2022-2023.
The female to male ratio is 1.22 to 1 and it means that there are slightly more female students enrolled in CCCCD than male students.
The following table and chart illustrate the changes in student population by gender at Collin County Community College District since 2012.
| Year | Total | Men | Women |
|---|---|---|---|
| 2012-13 | 27,424 | 11,935 | 15,489 |
| 2013-14 | 27,972 548 | 12,393 458 | 15,579 90 |
| 2014-15 | 27,991 19 | 12,371 -22 | 15,620 41 |
| 2015-16 | 28,188 197 | 12,698 327 | 15,490 -130 |
| 2016-17 | 29,703 1,515 | 13,314 616 | 16,389 899 |
| 2017-18 | 31,609 1,906 | 14,207 893 | 17,402 1,013 |
| 2018-19 | 33,668 2,059 | 14,897 690 | 18,771 1,369 |
| 2019-20 | 35,132 1,464 | 15,481 584 | 19,651 880 |
| 2020-21 | 35,390 258 | 15,112 -369 | 20,278 627 |
| 2021-22 | 33,686 -1,704 | 14,762 -350 | 18,924 -1,354 |
| 2022-23 | 35,077 1,391 | 15,784 1,022 | 19,293 369 |
| Average | 31,440 | 13,905 | 17,535 |