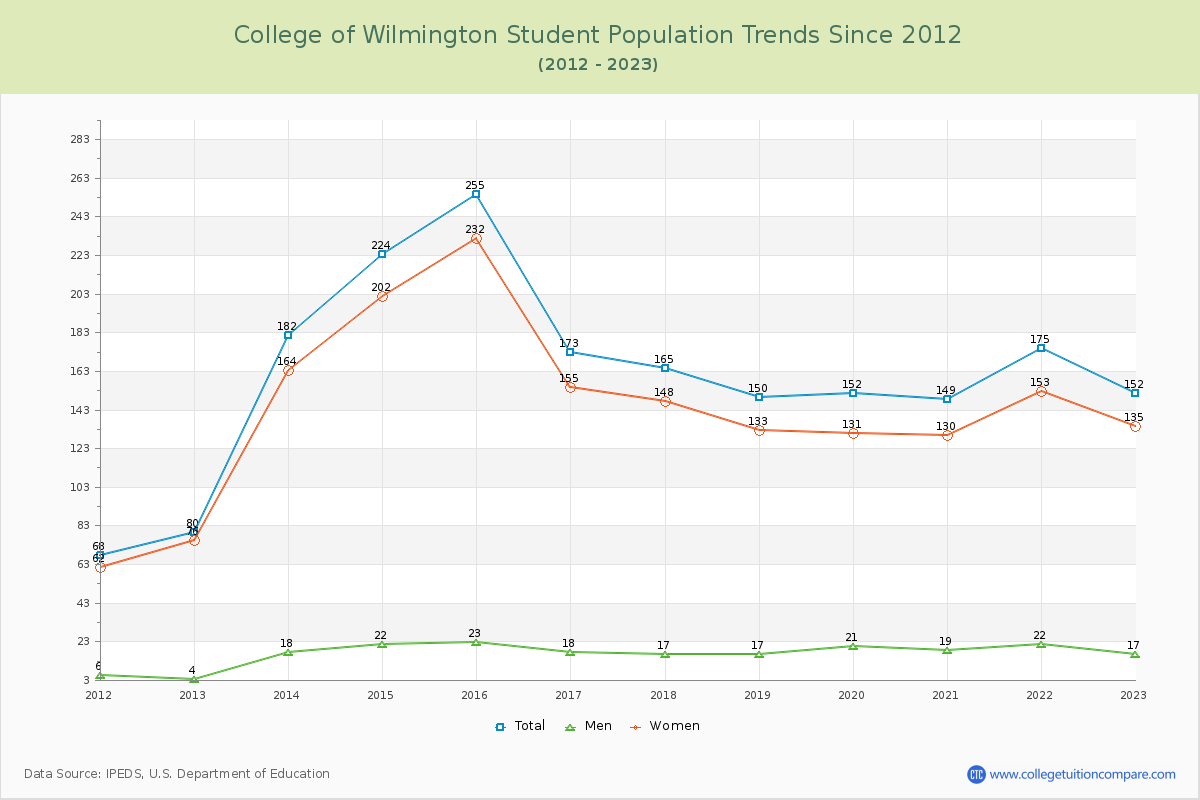
Student Population Changes
The average student population over the last 12 years is 169 where 152 students are attending the school for the academic year 2022-2023.
The female to male ratio is 7.94 to 1 and it means that there are far more female students enrolled in C of Wilmington than male students.
The following table and chart illustrate the changes in student population by gender at College of Wilmington since 2012.
| Year | Total | Men | Women |
|---|---|---|---|
| 2012-13 | 80 | 4 | 76 |
| 2013-14 | 182 102 | 18 14 | 164 88 |
| 2014-15 | 224 42 | 22 4 | 202 38 |
| 2015-16 | 255 31 | 23 1 | 232 30 |
| 2016-17 | 173 -82 | 18 -5 | 155 -77 |
| 2017-18 | 165 -8 | 17 -1 | 148 -7 |
| 2018-19 | 150 -15 | 17 0 | 133 -15 |
| 2019-20 | 152 2 | 21 4 | 131 -2 |
| 2020-21 | 149 -3 | 19 -2 | 130 -1 |
| 2021-22 | 175 26 | 22 3 | 153 23 |
| 2022-23 | 152 -23 | 17 -5 | 135 -18 |
| Average | 169 | 18 | 151 |