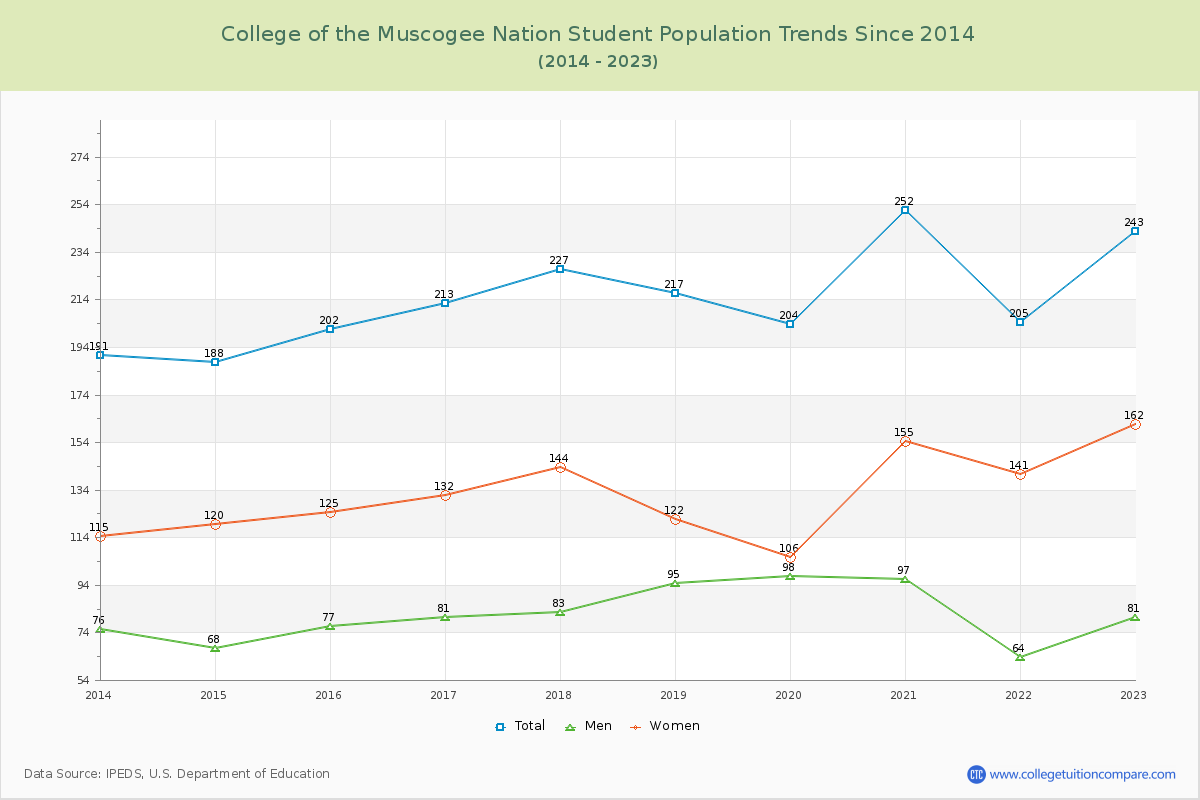
Student Population Changes
The average student population over the last 11 years is 214 where 243 students are attending the school for the academic year 2022-2023.
The female to male ratio is 2.00 to 1 and it means that there are more female students enrolled in C of the Muscogee Nation than male students.
The following table and chart illustrate the changes in student population by gender at College of the Muscogee Nation since 2013.
| Year | Total | Men | Women |
|---|---|---|---|
| 2013-14 | 191 | 76 | 115 |
| 2014-15 | 188 -3 | 68 -8 | 120 5 |
| 2015-16 | 202 14 | 77 9 | 125 5 |
| 2016-17 | 213 11 | 81 4 | 132 7 |
| 2017-18 | 227 14 | 83 2 | 144 12 |
| 2018-19 | 217 -10 | 95 12 | 122 -22 |
| 2019-20 | 204 -13 | 98 3 | 106 -16 |
| 2020-21 | 252 48 | 97 -1 | 155 49 |
| 2021-22 | 205 -47 | 64 -33 | 141 -14 |
| 2022-23 | 243 38 | 81 17 | 162 21 |
| Average | 214 | 82 | 132 |