Enrollment Trends at Elms College

-444

Total Enrollment

-64

Men

-380

Women

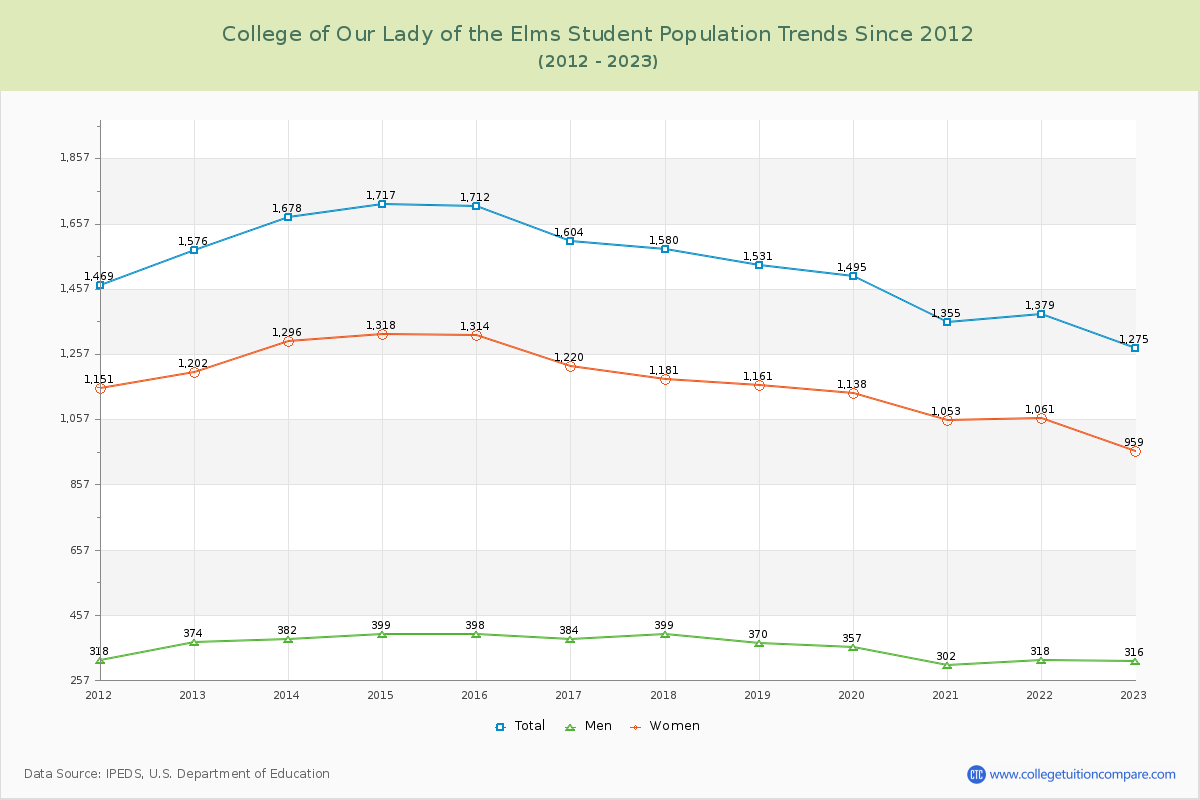
The student population at College of Our Lady of the Elms is 1,268 (1,002 undergraduate and 266 graduate students) . The number of students has decreased by 444 over the past decade.

The percentage of undergraduate students at Elms College is 79.02% which is decreased by 309 over last 10 years. The graduate student population decreased by 135 and it has been decreasing.

The female to male ratio is 2.80 to 1 which means that majority of population is on female students.

279 students enrolled in online degree program exclusively and the number of online students has increased by 580.49% since 2015.

Student Population Changes

The average student population over the last 11 years is 1,453 where 1,268 students are attending the school for the academic year 2024-2025.

79.02% of total students is undergraduate students and 20.98% students is graduate students. The number of undergraduate students has decreased by 309 and the graduate enrollment has decreased by 135 over past 10 years.

The female to male ratio is 2.80 to 1 and it means that there are far more female students enrolled in Elms College than male students.

The following table and chart illustrate the changes in student population by gender at College of Our Lady of the Elms since 2015.

YearTotalUndergraduateGraduate
TotalMenWomenTotalMenWomen
2015-161,7121,31131999240179322
2016-171,604
-108
1,188
-123
301
-18
887
-105
416
15
83
4
333
11
2017-181,580
-24
1,174
-14
307
6
867
-20
406
-10
92
9
314
-19
2018-191,531
-49
1,151
-23
283
-24
868
1
380
-26
87
-5
293
-21
2019-201,495
-36
1,123
-28
275
-8
848
-20
372
-8
82
-5
290
-3
2020-211,355
-140
1,030
-93
238
-37
792
-56
325
-47
64
-18
261
-29
2021-221,379
24
1,060
30
251
13
809
17
319
-6
67
3
252
-9
2022-231,275
-104
980
-80
252
1
728
-81
295
-24
64
-3
231
-21
2023-241,332
57
1,038
58
299
47
739
11
294
-1
56
-8
238
7
2024-251,268
-64
1,002
-36
278
-21
724
-15
266
-28
56210
-28
Average1,4531,10628082534773274
College of Our Lady of the Elms Enrollment Trends Chart

Undergraduate Enrollment Changes

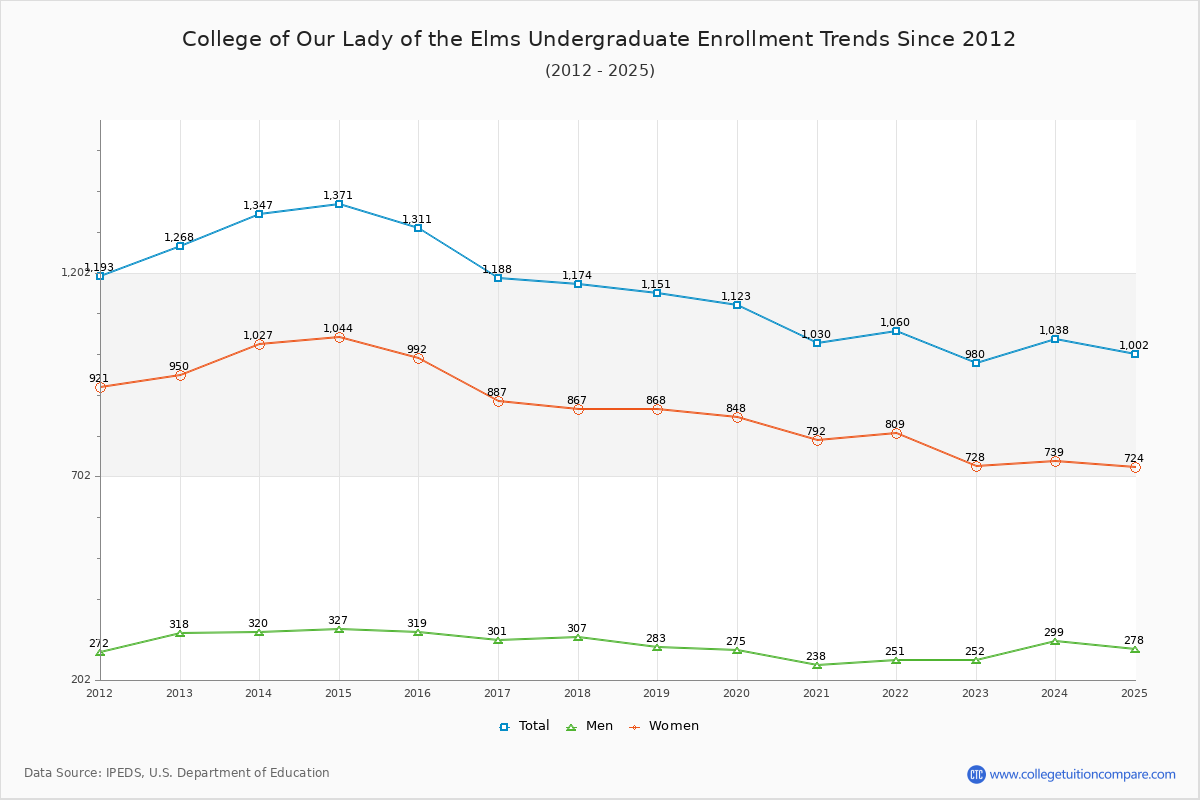
The average number of Undergraduate students over the last 11 years is 1,106 where 1,002 students are attending the Undergraduate school for the academic year 2024-2025. The following table and chart illustrate the changes in Undergraduate enrollment by attending status and gender at College of Our Lady of the Elms since 2015.

YearTotalFull-timePart-time
TotalMenWomenTotalMenWomen
2015-161,31196924872134271271
2016-171,18895424670823455179
2017-181,17497325771620150151
2018-191,1511,00324775614836112
2019-201,1239972437541263294
2020-211,03088120567614933116
2021-221,06088521067517541134
2022-2398079721758018335148
2023-241,03885925360617946133
2024-251,00286323962413939100
Average1,1061,1062376821,10644144
College of Our Lady of the Elms Undergraduate Enrollment Trends Chart

Graduate Enrollment Changes

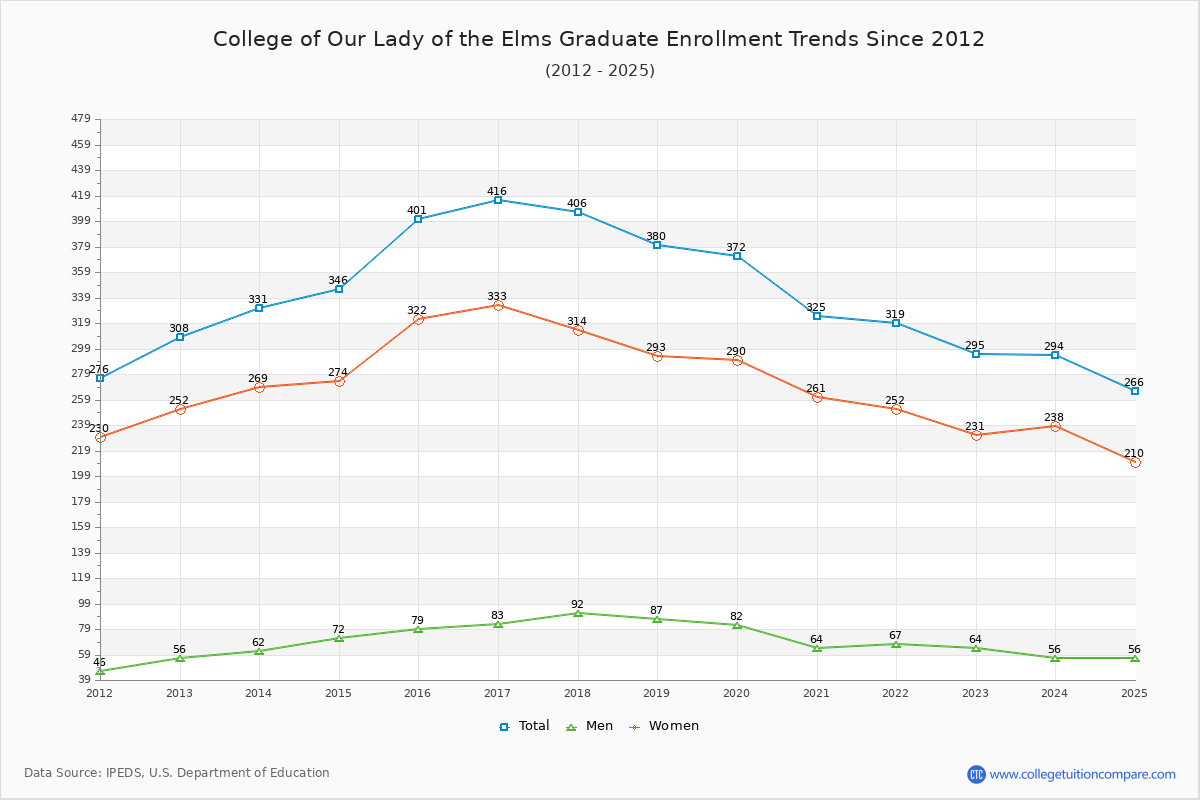
The average number of Graduate students over the last 11 years is 347 where 266 students are attending the Graduate school for the academic year 2024-2025. The following table and chart illustrate the changes in Graduate enrollment by attending status and gender at College of Our Lady of the Elms since 2015.

YearTotalFull-timePart-time
TotalMenWomenTotalMenWomen
2015-1640161204134059281
2016-1741696158132068252
2017-18406103346930358245
2018-19380109288127159212
2019-20372100346627248224
2020-21325106307621934185
2021-22319100247621943176
2022-2329592266620338165
2023-2429486196720837171
2024-25266109228715734123
Average347347257134748203
College of Our Lady of the Elms Graduate Enrollment Trends Chart

Enrollment by Race/Ethnicity Changes

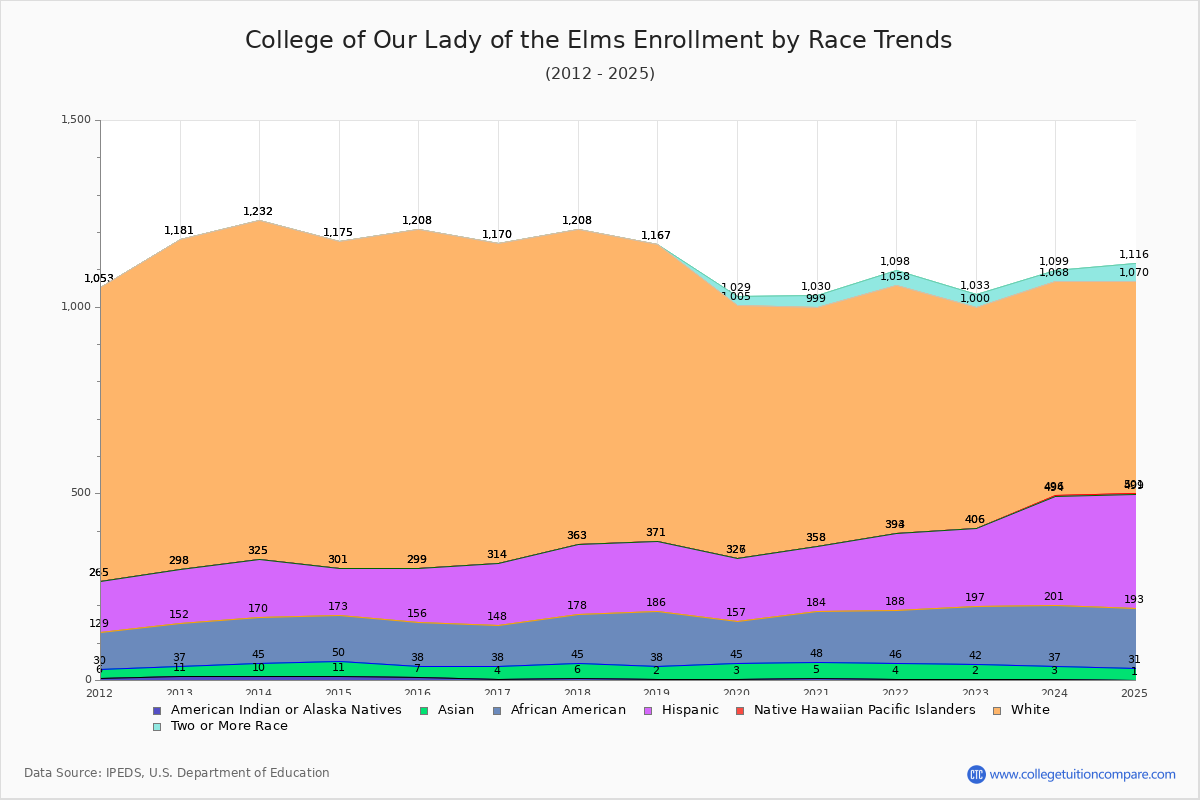
The percentage of white students is 44.87% and the percentage of black students is 12.78% at College of Our Lady of the Elms. 2.37% of enrolled students is Asian. Hispanic students comprise 24.13% of the student body.

Over the past 10 years, the racial composition has shifted. The percentage of white students decreased from 53.10% to 44.87%. Asian enrollment grew from 1.81% to 2.37%. Black student enrollment increased from 6.89% to 12.78%. Hispanic student representation expanded from 8.35% to 24.13%.

The overall racial diversity, measured by the Census Bureau Diversity Index, is 0.7222 which indicates that quite diverse. This increased from 0.7060 a decade ago, suggesting that racial diversity has improved.

The following table and chart illustrate the student population trends by race/ethnicity at College of Our Lady of the Elms over the past 11 years (2015-2025).

YearAmerican Indian or Native AmericanAsianBlackHispanicNative Hawaiian or Other Pacific IslanderWhiteTwo or More Races
2015-1673111814309090
2016-1743411016608560
2017-1863913318508450
2018-1923614818507960
2019-20342112169167824
2020-21543136174064131
2021-22442142205166440
2022-23240155209059433
2023-24334164293257231
2024-25130162306256946
Average437138204171221
College of Our Lady of the Elms Enrollment by Race Trends Chart

Distance Learning (Online Courses) Enrollment Changes

279 students are enrolled in online degree programs exclusively for the academic year 2024-2025, which is 22% of total students. The number of online students has increased 580.49% since 2015. The following table and chart illustrate the changes in the online student population by enrolled type at College of Our Lady of the Elms from 2015 to 2025.

YearTotal EnrollmentOnline CompletelyEnrolled in Some Online CoursesNot Enrolled in Online Courses
2015-161,712413941,277
2016-171,604512331,320
2017-181,580572191,304
2018-191,531982891,144
2019-201,4951562671,072
2020-211,355160446749
2021-221,379221395763
2022-231,275240363672
2023-241,332266433633
2024-251,268279403586
Average1,453157344952

Ratings & Review

Share your experiences and thoughts about College of Our Lady of the Elms. It will be a great help to applicants and prospective students!