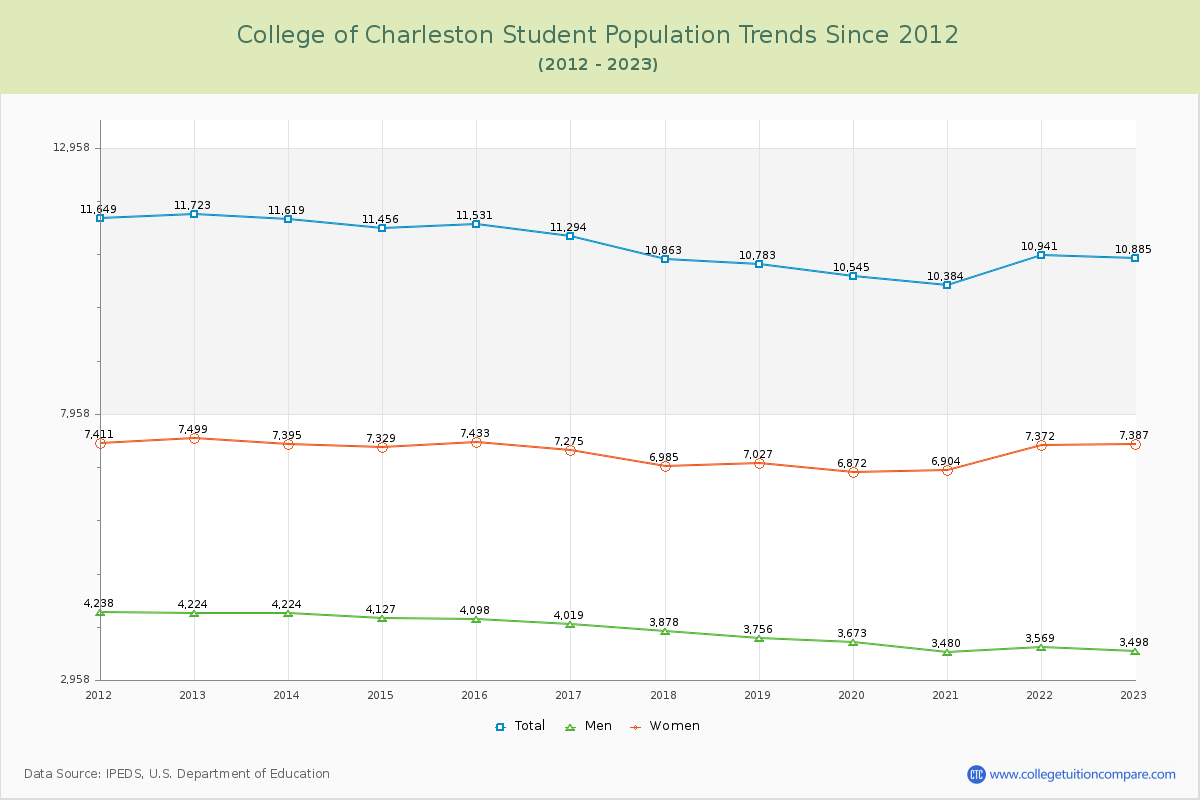
Student Population Changes
The average student population over the last 12 years is 11,093 where 10,885 students are attending the school for the academic year 2022-2023.
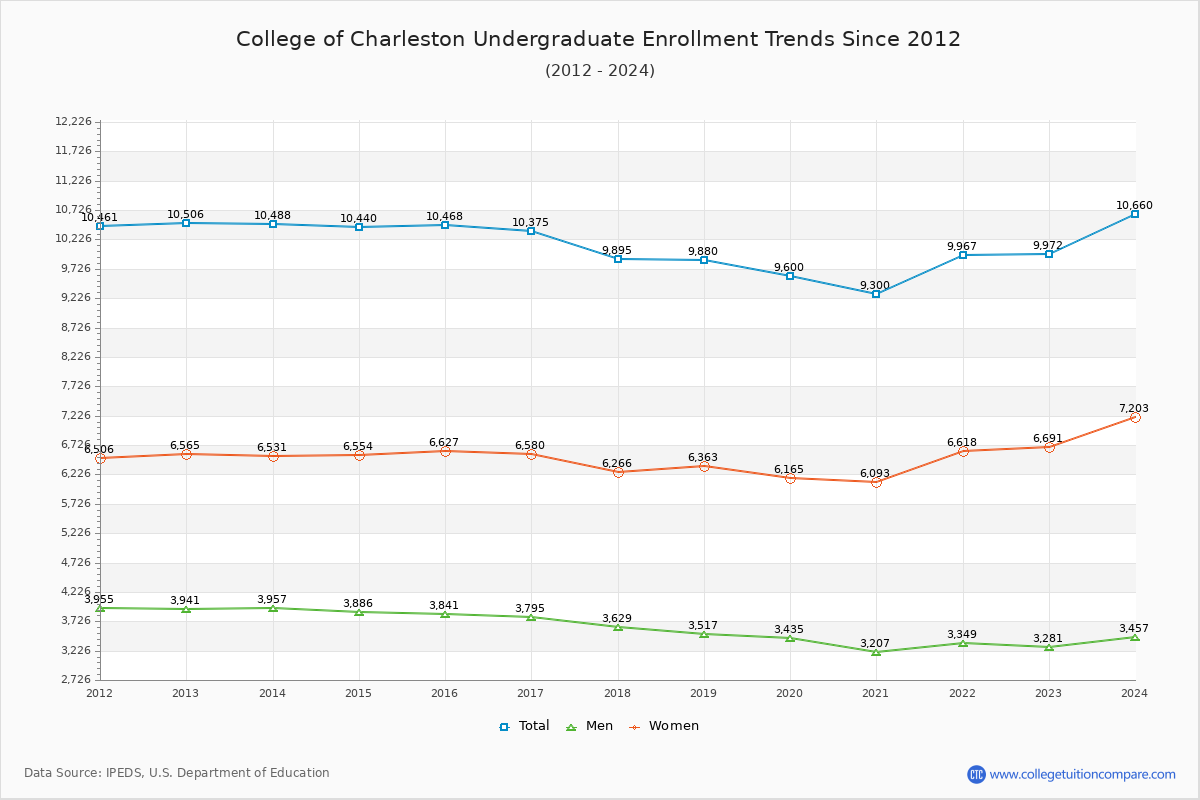
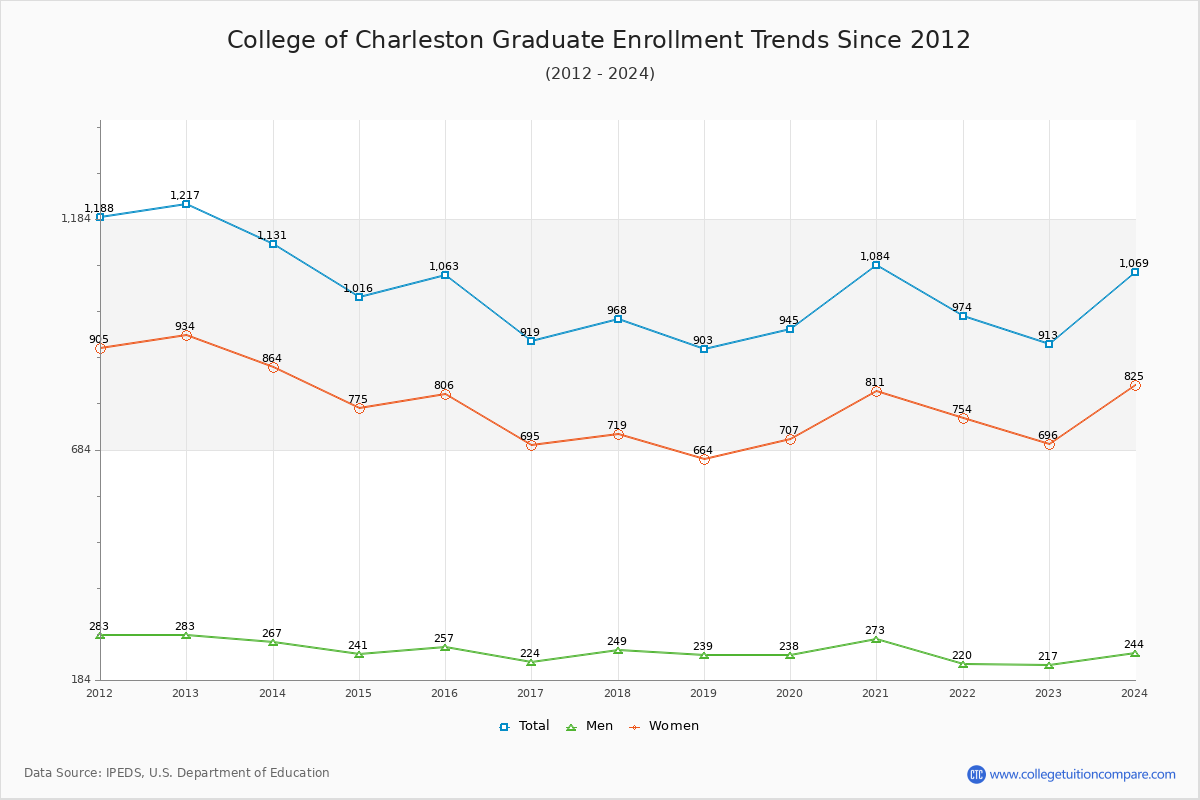
91.61% of total students is undergraduate students and 8.39% students is graduate students. The number of undergraduate students has decreased by 534 and the graduate enrollment has decreased by 304 over past 10 years.
The female to male ratio is 2.11 to 1 and it means that there are far more female students enrolled in C of Charleston than male students.
The following table and chart illustrate the changes in student population by gender at College of Charleston since 2012.
| Year | Total | Undergraduate | Graduate | ||||
|---|---|---|---|---|---|---|---|
| Total | Men | Women | Total | Men | Women | ||
| 2012-13 | 11,723 | 10,506 | 3,941 | 6,565 | 1,217 | 283 | 934 |
| 2013-14 | 11,619 -104 | 10,488 -18 | 3,957 16 | 6,531 -34 | 1,131 -86 | 267 -16 | 864 -70 |
| 2014-15 | 11,456 -163 | 10,440 -48 | 3,886 -71 | 6,554 23 | 1,016 -115 | 241 -26 | 775 -89 |
| 2015-16 | 11,531 75 | 10,468 28 | 3,841 -45 | 6,627 73 | 1,063 47 | 257 16 | 806 31 |
| 2016-17 | 11,294 -237 | 10,375 -93 | 3,795 -46 | 6,580 -47 | 919 -144 | 224 -33 | 695 -111 |
| 2017-18 | 10,863 -431 | 9,895 -480 | 3,629 -166 | 6,266 -314 | 968 49 | 249 25 | 719 24 |
| 2018-19 | 10,783 -80 | 9,880 -15 | 3,517 -112 | 6,363 97 | 903 -65 | 239 -10 | 664 -55 |
| 2019-20 | 10,545 -238 | 9,600 -280 | 3,435 -82 | 6,165 -198 | 945 42 | 238 -1 | 707 43 |
| 2020-21 | 10,384 -161 | 9,300 -300 | 3,207 -228 | 6,093 -72 | 1,084 139 | 273 35 | 811 104 |
| 2021-22 | 10,941 557 | 9,967 667 | 3,349 142 | 6,618 525 | 974 -110 | 220 -53 | 754 -57 |
| 2022-23 | 10,885 -56 | 9,972 5 | 3,281 -68 | 6,691 73 | 913 -61 | 217 -3 | 696 -58 |
| Average | 11,093 | 10,081 | 3,622 | 6,459 | 1,012 | 246 | 766 |