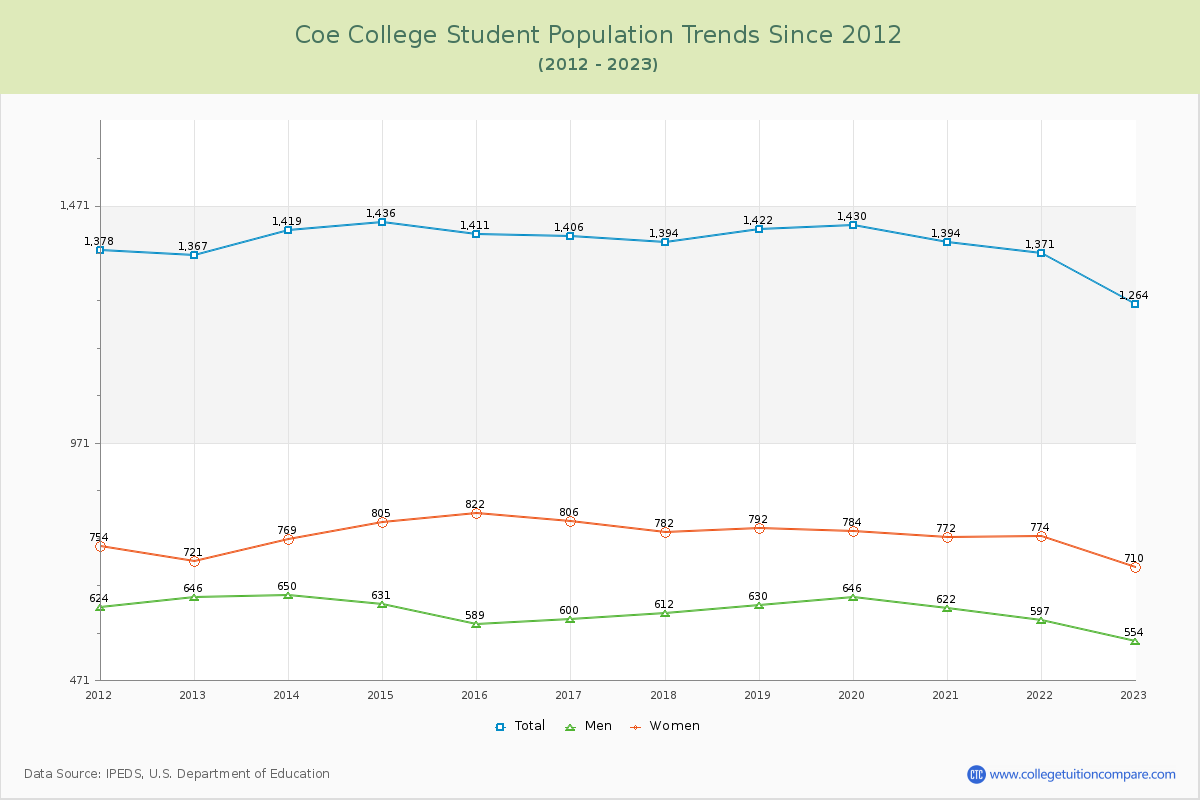
Student Population Changes
The average student population over the last 12 years is 1,392 where 1,264 students are attending the school for the academic year 2022-2023.
The female to male ratio is 1.28 to 1 and it means that there are slightly more female students enrolled in Coe than male students.
The following table and chart illustrate the changes in student population by gender at Coe College since 2012.
| Year | Total | Men | Women |
|---|---|---|---|
| 2012-13 | 1,364 | 644 | 720 |
| 2013-14 | 1,419 55 | 650 6 | 769 49 |
| 2014-15 | 1,435 16 | 631 -19 | 804 35 |
| 2015-16 | 1,411 -24 | 589 -42 | 822 18 |
| 2016-17 | 1,406 -5 | 600 11 | 806 -16 |
| 2017-18 | 1,394 -12 | 612 12 | 782 -24 |
| 2018-19 | 1,422 28 | 630 18 | 792 10 |
| 2019-20 | 1,430 8 | 646 16 | 784 -8 |
| 2020-21 | 1,394 -36 | 622 -24 | 772 -12 |
| 2021-22 | 1,371 -23 | 597 -25 | 774 2 |
| 2022-23 | 1,264 -107 | 554 -43 | 710 -64 |
| Average | 1,392 | 616 | 776 |