Enrollment Trends at Cleveland Institute of Music

-139

Total Enrollment

-70

Men

-69

Women

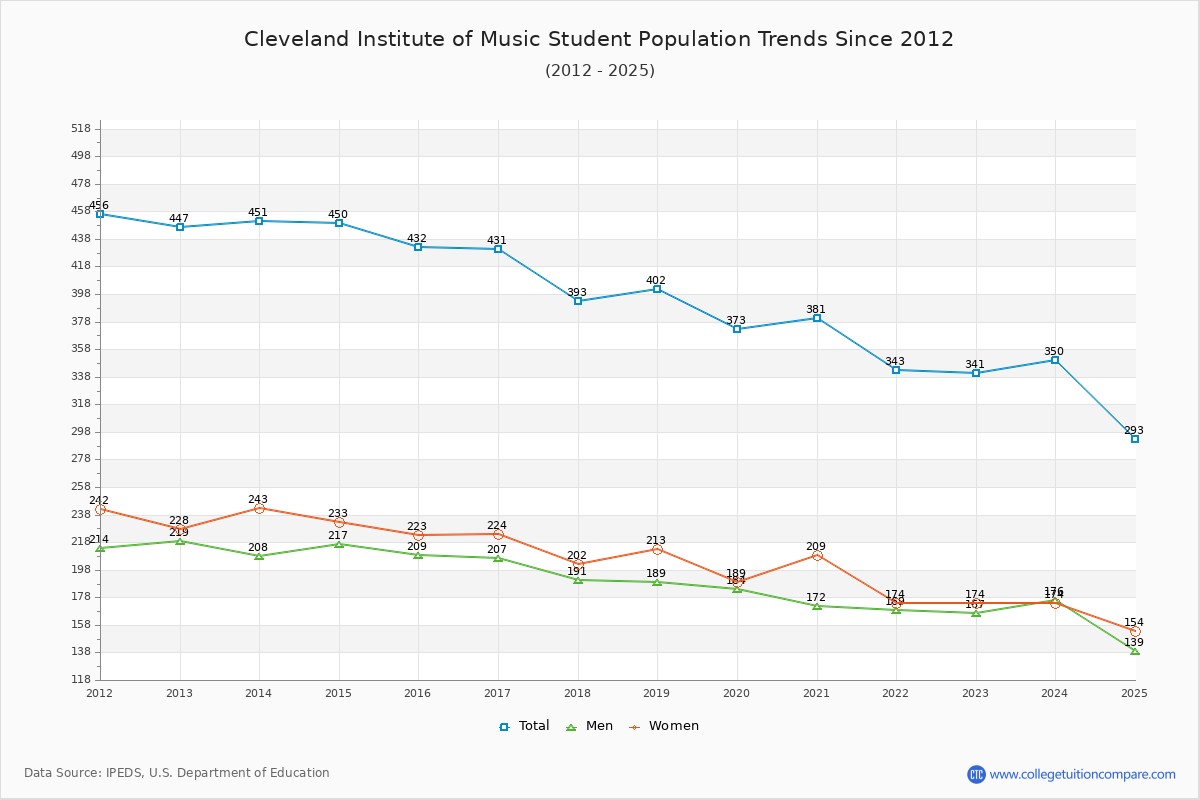
The student population at Cleveland Institute of Music is 293 (159 undergraduate and 134 graduate students) . The number of students has decreased by 139 over the past decade.

The percentage of undergraduate students at Cleveland Institute of Music is 54.27% which is decreased by 80 over last 10 years. The graduate student population decreased by 59 and it has been decreasing.

The female to male ratio is 1.11 to 1 which means that female students enrolled slightly more than male students.

All students have enrolled in on-campus classes (Cleveland Institute of Music does not offer online degree/certificate program).

Student Population Changes

The average student population over the last 11 years is 374 where 293 students are attending the school for the academic year 2024-2025.

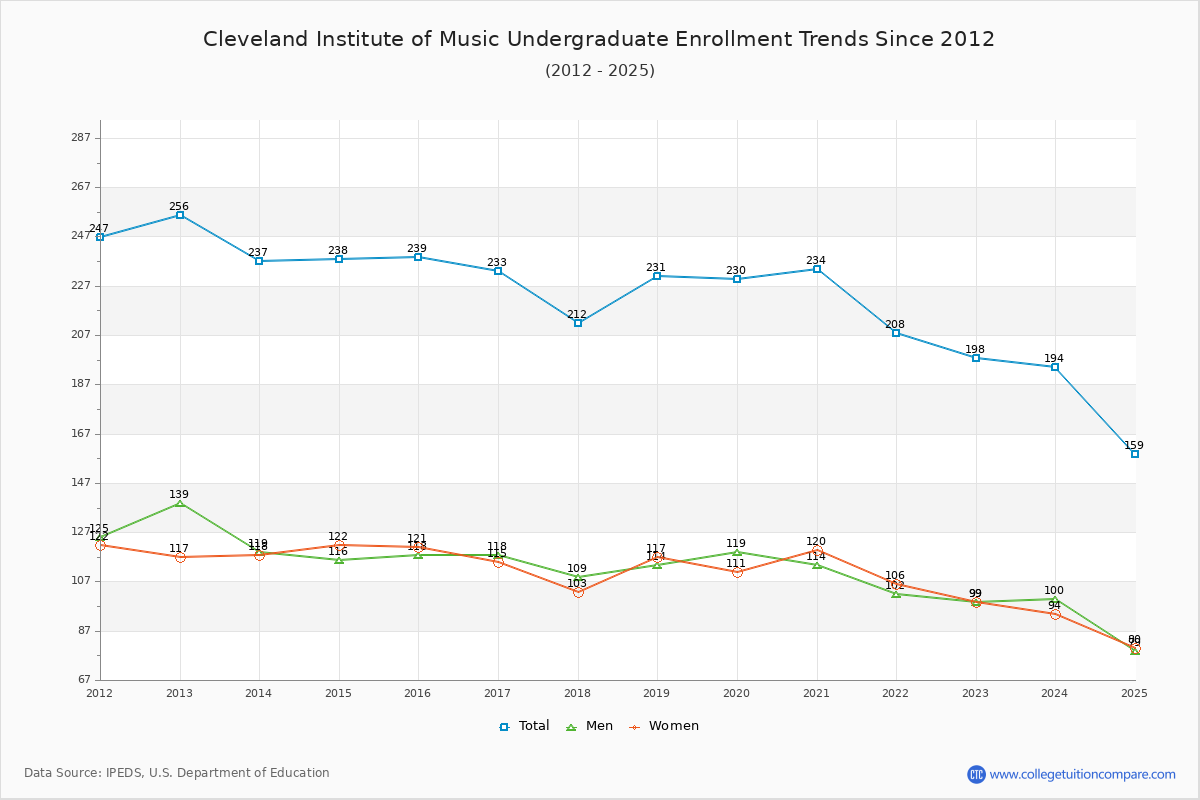
54.27% of total students is undergraduate students and 45.73% students is graduate students. The number of undergraduate students has decreased by 80 and the graduate enrollment has decreased by 59 over past 10 years.

The female to male ratio is 1.11 to 1 and it means that there are slightly more female students enrolled in Cleveland Institute of Music than male students.

The following table and chart illustrate the changes in student population by gender at Cleveland Institute of Music since 2015.

YearTotalUndergraduateGraduate
TotalMenWomenTotalMenWomen
2015-1643223911812119391102
2016-17431
-1
233
-6
118115
-6
198
5
89
-2
109
7
2017-18393
-38
212
-21
109
-9
103
-12
181
-17
82
-7
99
-10
2018-19402
9
231
19
114
5
117
14
171
-10
75
-7
96
-3
2019-20373
-29
230
-1
119
5
111
-6
143
-28
65
-10
78
-18
2020-21381
8
234
4
114
-5
120
9
147
4
58
-7
89
11
2021-22343
-38
208
-26
102
-12
106
-14
135
-12
67
9
68
-21
2022-23341
-2
198
-10
99
-3
99
-7
143
8
68
1
75
7
2023-24350
9
194
-4
100
1
94
-5
156
13
76
8
80
5
2024-25293
-57
159
-35
79
-21
80
-14
134
-22
60
-16
74
-6
Average3742141071071607387
Cleveland Institute of Music Enrollment Trends Chart

Undergraduate Enrollment Changes

The average number of Undergraduate students over the last 11 years is 214 where 159 students are attending the Undergraduate school for the academic year 2024-2025. The following table and chart illustrate the changes in Undergraduate enrollment by attending status and gender at Cleveland Institute of Music since 2015.

YearTotalMenWomen
2015-16239239118121000
2016-17233233118115000
2017-18212212109103000
2018-19231231114117000
2019-20230230119111000
2020-21234234114120000
2021-22208208102106000
2022-231981989999000
2023-2419419410094000
2024-251591597980000
Average21421410710721400
Cleveland Institute of Music Undergraduate Enrollment Trends Chart

Graduate Enrollment Changes

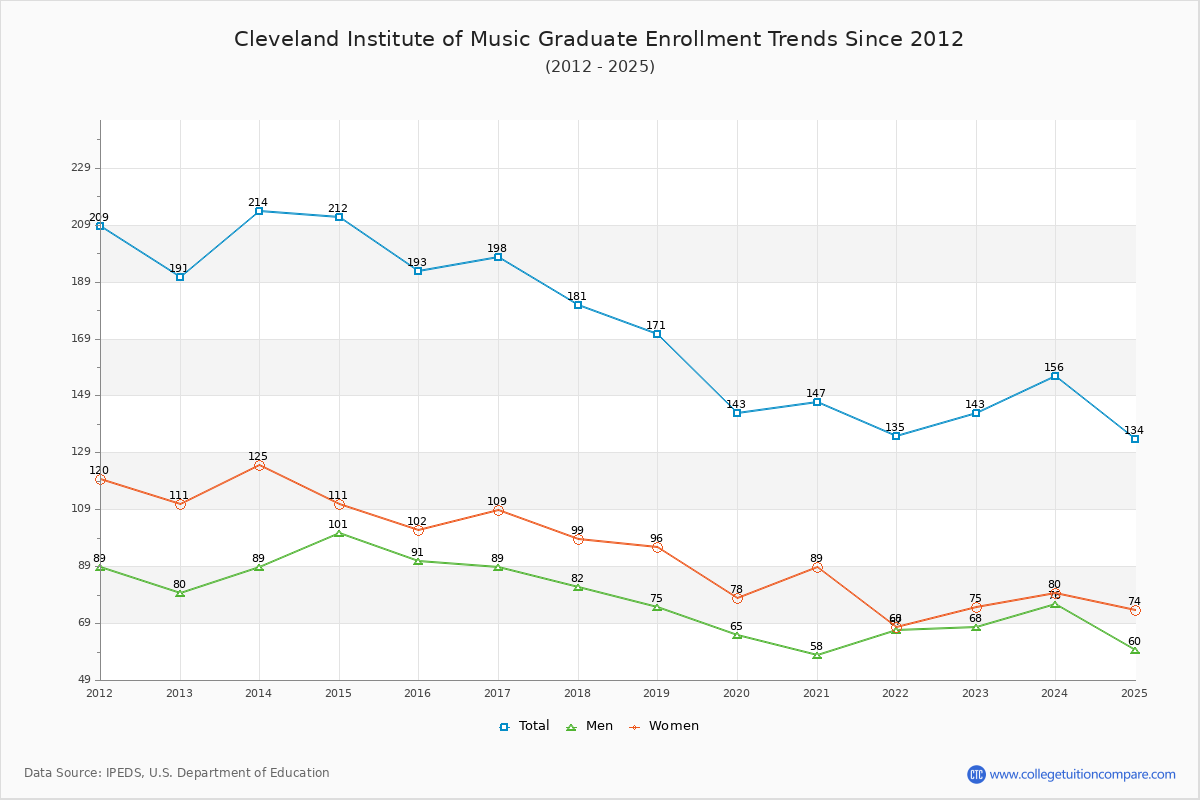
The average number of Graduate students over the last 11 years is 160 where 134 students are attending the Graduate school for the academic year 2024-2025. The following table and chart illustrate the changes in Graduate enrollment by attending status and gender at Cleveland Institute of Music since 2015.

YearTotalFull-timePart-time
TotalMenWomenTotalMenWomen
2015-1619318786101651
2016-17198187841031156
2017-181811798297202
2018-191711657491615
2019-201431416378220
2020-211471465888101
2021-221351356768000
2022-231431396673422
2023-241561557679101
2024-251341306070404
Average160160728516022
Cleveland Institute of Music Graduate Enrollment Trends Chart

Enrollment by Race/Ethnicity Changes

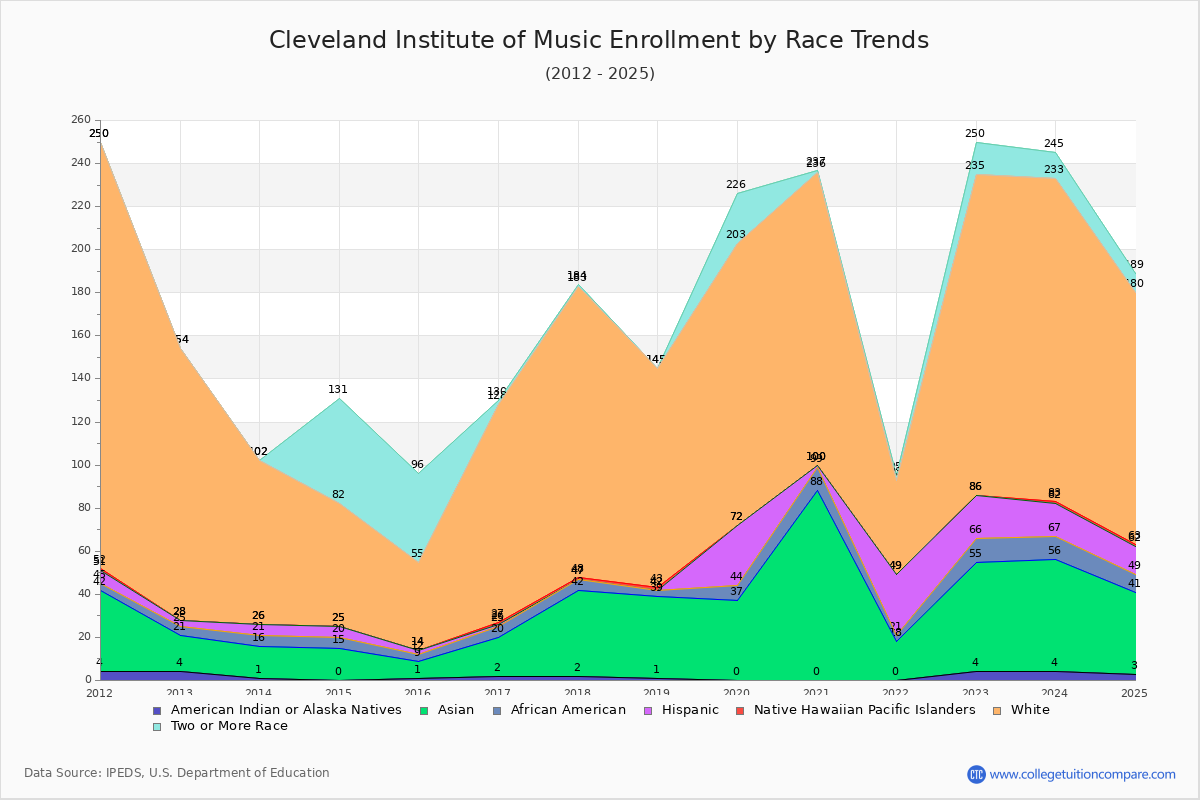
The percentage of white students is 39.93% and the percentage of black students is 2.73% at Cleveland Institute of Music. 12.97% of enrolled students is Asian. Hispanic students comprise 4.44% of the student body.

Over the past 10 years, the racial composition has shifted. The percentage of white students increased from 9.49% to 39.93%. Asian enrollment grew from 1.85% to 12.97%. Black student enrollment increased from 0.69% to 2.73%. Hispanic student representation expanded from 0.46% to 4.44%.

The overall racial diversity, measured by the Census Bureau Diversity Index, is 0.8200 which indicates that highly diverse. This decreased from 0.9816 a decade ago, suggesting that racial diversity has declined.

The following table and chart illustrate the student population trends by race/ethnicity at Cleveland Institute of Music over the past 11 years (2015-2025).

YearAmerican Indian or Native AmericanAsianBlackHispanicNative Hawaiian or Other Pacific IslanderWhiteTwo or More Races
2015-16183204141
2016-172185111012
2017-182405011351
2018-191383011020
2019-20037728013123
2020-2108811101361
2021-220183280442
2022-234511120014915
2023-244521115115012
2024-2533881311179
Average239711111111
Cleveland Institute of Music Enrollment by Race Trends Chart

Distance Learning (Online Courses) Enrollment Changes

Cleveland Institute of Music does not offer online degree/certificate programs. All Students have enrolled in on-campus programs.


Ratings & Review

Share your experiences and thoughts about Cleveland Institute of Music. It will be a great help to applicants and prospective students!