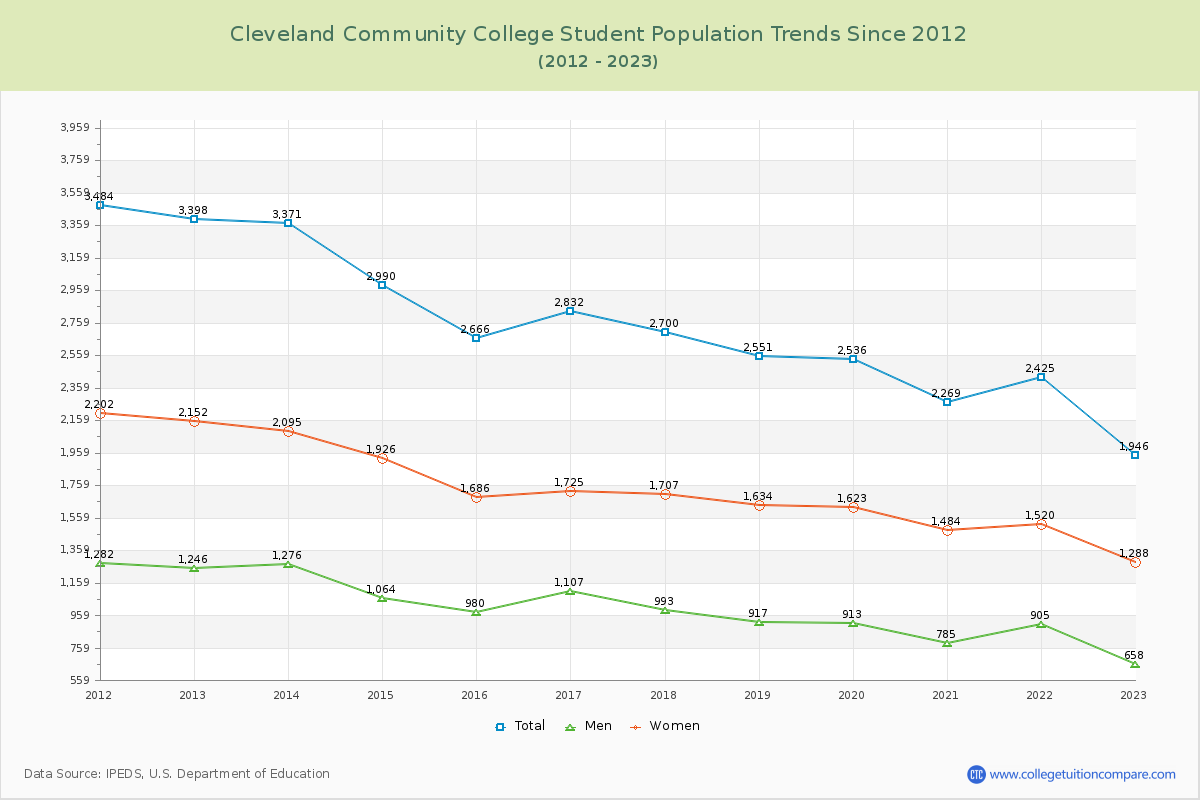
Student Population Changes
The average student population over the last 12 years is 2,699 where 1,946 students are attending the school for the academic year 2022-2023.
The female to male ratio is 1.96 to 1 and it means that there are more female students enrolled in Cleveland CC than male students.
The following table and chart illustrate the changes in student population by gender at Cleveland Community College since 2012.
| Year | Total | Men | Women |
|---|---|---|---|
| 2012-13 | 3,398 | 1,246 | 2,152 |
| 2013-14 | 3,371 -27 | 1,276 30 | 2,095 -57 |
| 2014-15 | 2,990 -381 | 1,064 -212 | 1,926 -169 |
| 2015-16 | 2,666 -324 | 980 -84 | 1,686 -240 |
| 2016-17 | 2,832 166 | 1,107 127 | 1,725 39 |
| 2017-18 | 2,700 -132 | 993 -114 | 1,707 -18 |
| 2018-19 | 2,551 -149 | 917 -76 | 1,634 -73 |
| 2019-20 | 2,536 -15 | 913 -4 | 1,623 -11 |
| 2020-21 | 2,269 -267 | 785 -128 | 1,484 -139 |
| 2021-22 | 2,425 156 | 905 120 | 1,520 36 |
| 2022-23 | 1,946 -479 | 658 -247 | 1,288 -232 |
| Average | 2,699 | 986 | 1,713 |