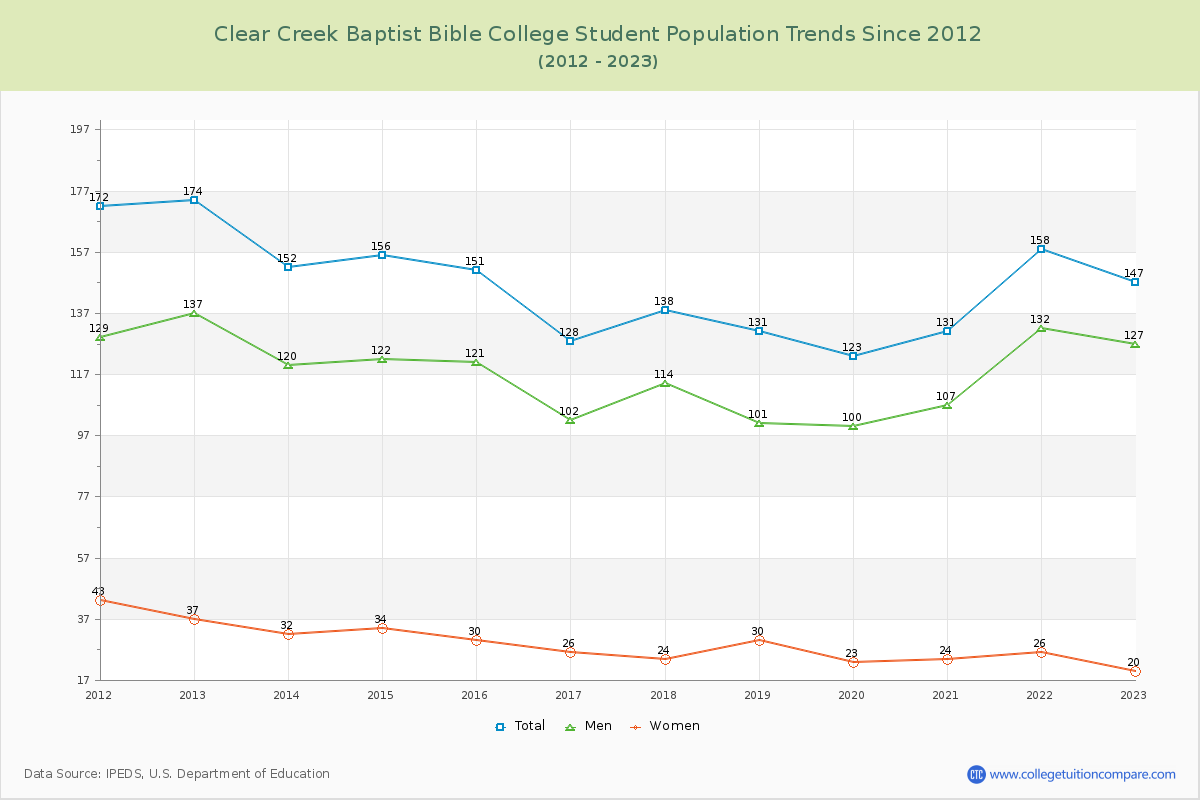
Student Population Changes
The average student population over the last 12 years is 144 where 147 students are attending the school for the academic year 2022-2023.
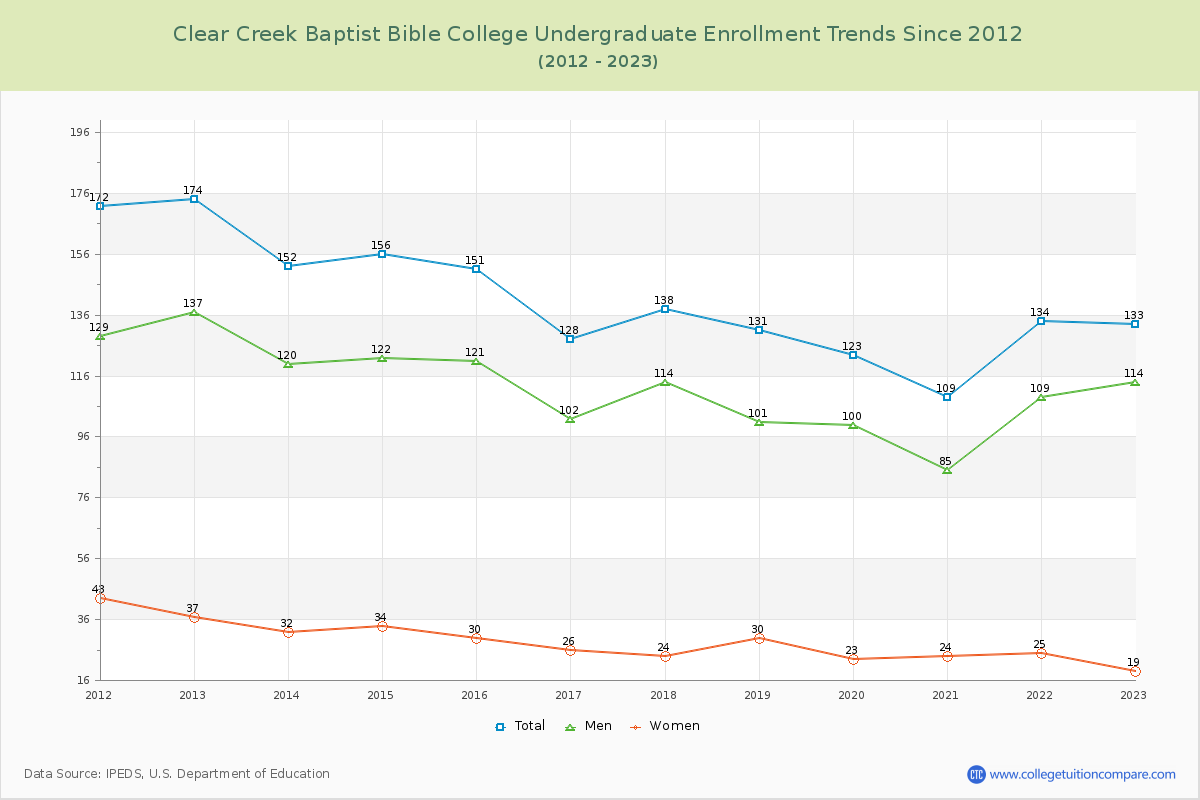
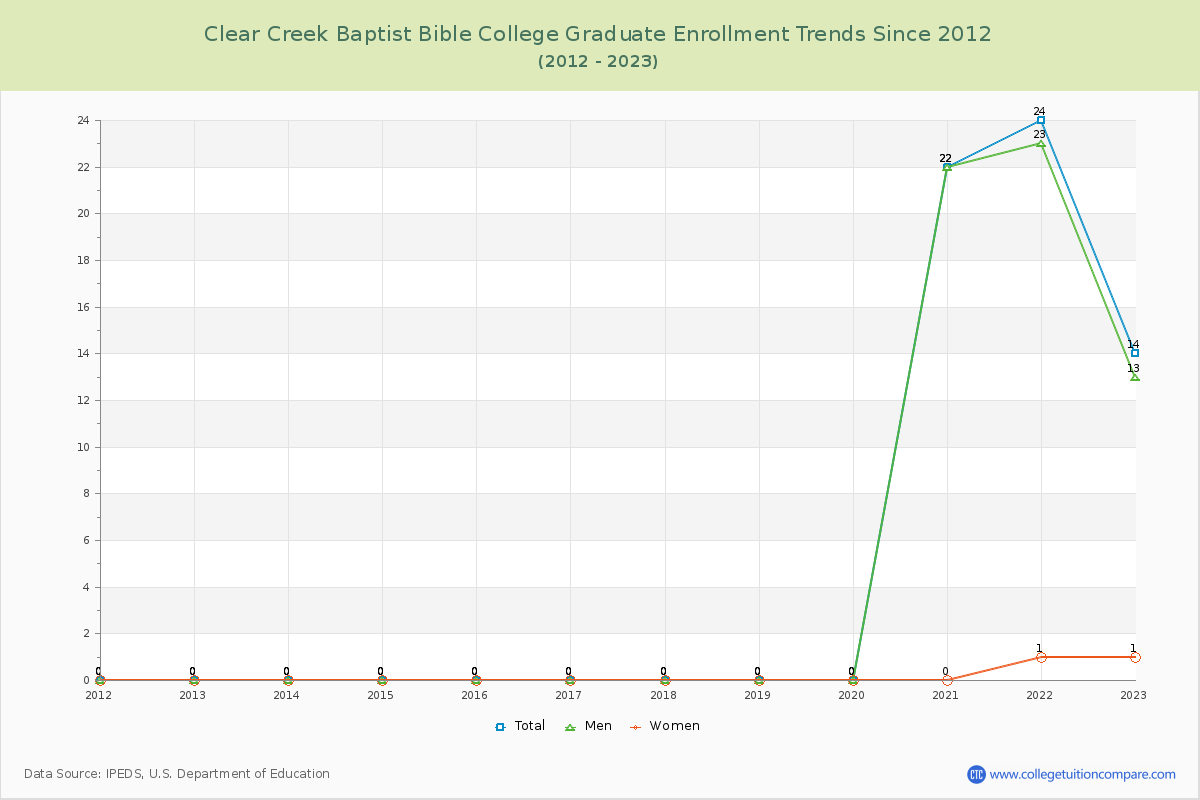
90.48% of total students is undergraduate students and 9.52% students is graduate students. The number of undergraduate students has decreased by 41 and the graduate enrollment has increased by 14 over past 10 years.
The female to male ratio is 0.16 to 1 and it means that there are far more male students enrolled in CCBBC than female students.
The following table and chart illustrate the changes in student population by gender at Clear Creek Baptist Bible College since 2012.
| Year | Total | Undergraduate | Graduate | ||||
|---|---|---|---|---|---|---|---|
| Total | Men | Women | Total | Men | Women | ||
| 2012-13 | 174 | 174 | 137 | 37 | 0 | 0 | 0 |
| 2013-14 | 152 -22 | 152 -22 | 120 -17 | 32 -5 | 0 0 | 0 0 | 0 0 |
| 2014-15 | 156 4 | 156 4 | 122 2 | 34 2 | 0 0 | 0 0 | 0 0 |
| 2015-16 | 151 -5 | 151 -5 | 121 -1 | 30 -4 | 0 0 | 0 0 | 0 0 |
| 2016-17 | 128 -23 | 128 -23 | 102 -19 | 26 -4 | 0 0 | 0 0 | 0 0 |
| 2017-18 | 138 10 | 138 10 | 114 12 | 24 -2 | 0 0 | 0 0 | 0 0 |
| 2018-19 | 131 -7 | 131 -7 | 101 -13 | 30 6 | 0 0 | 0 0 | 0 0 |
| 2019-20 | 123 -8 | 123 -8 | 100 -1 | 23 -7 | 0 0 | 0 0 | 0 0 |
| 2020-21 | 131 8 | 109 -14 | 85 -15 | 24 1 | 22 22 | 22 22 | 0 0 |
| 2021-22 | 158 27 | 134 25 | 109 24 | 25 1 | 24 2 | 23 1 | 1 1 |
| 2022-23 | 147 -11 | 133 -1 | 114 5 | 19 -6 | 14 -10 | 13 -10 | 1 0 |
| Average | 144 | 139 | 111 | 28 | 5 | 5 | 0 |