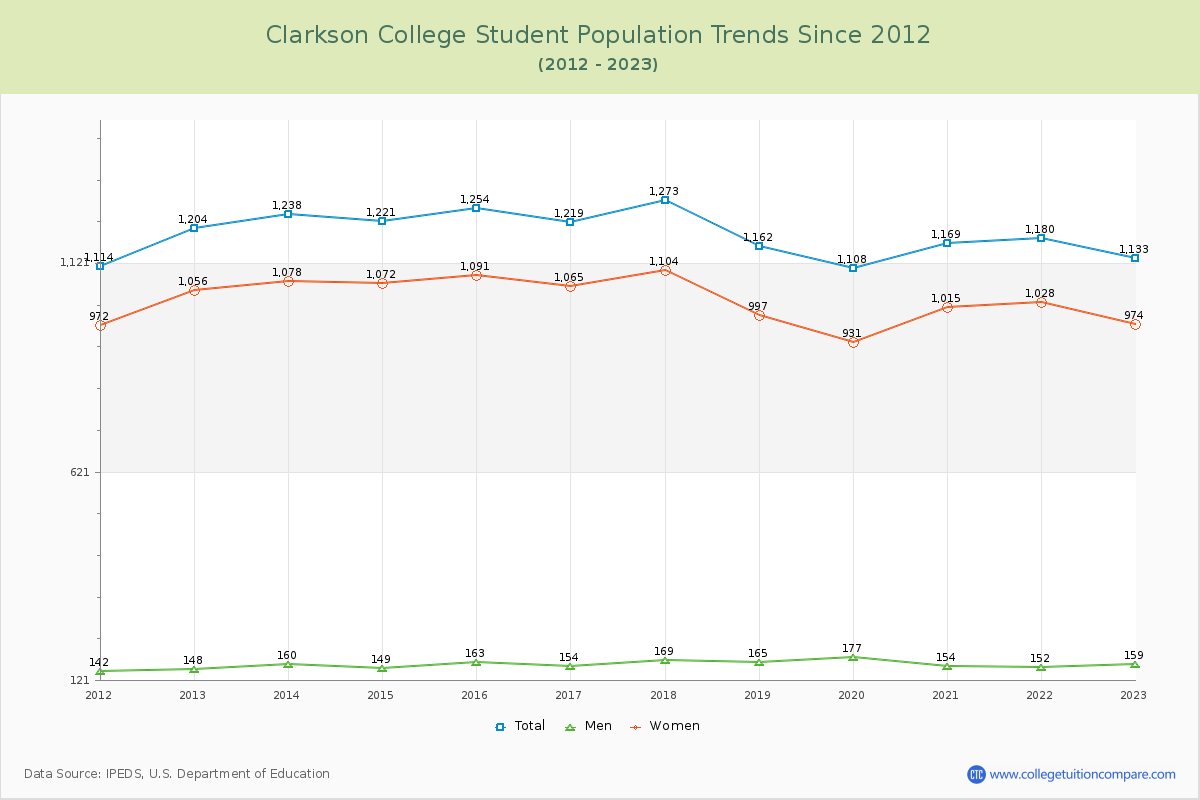
Student Population Changes
The average student population over the last 12 years is 1,196 where 1,133 students are attending the school for the academic year 2022-2023.
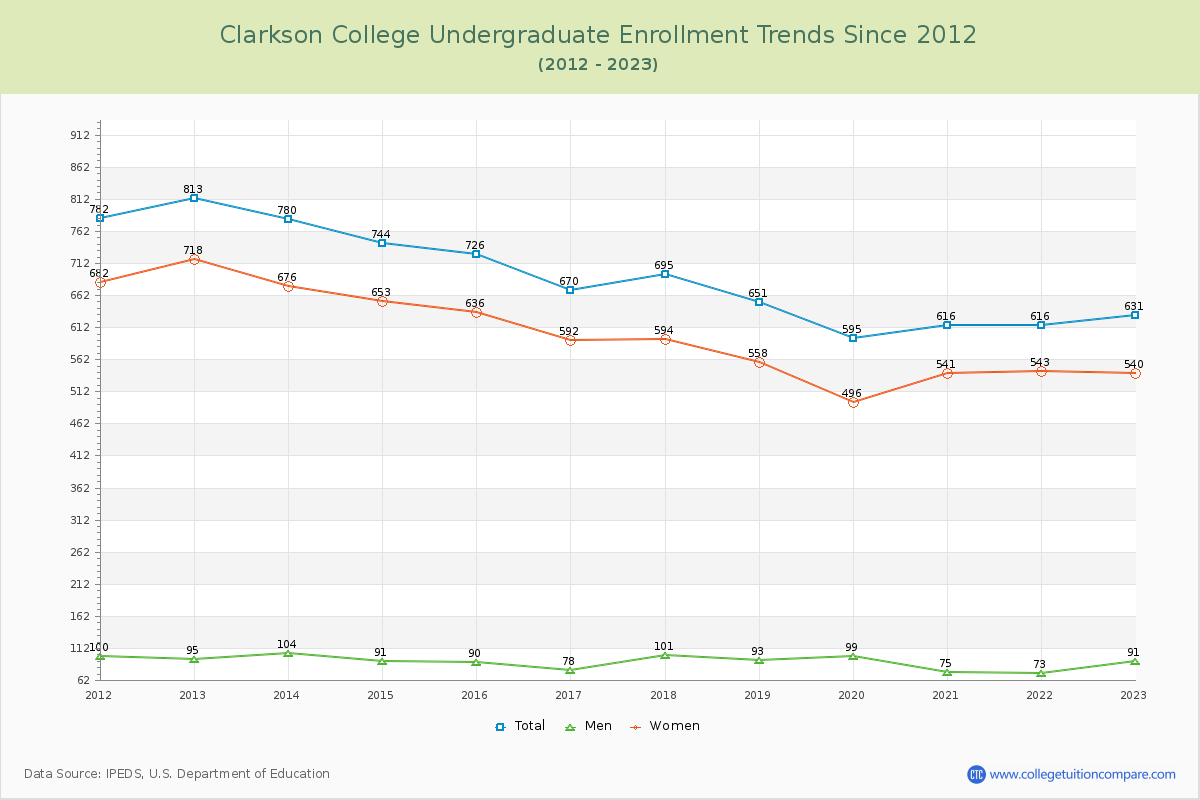
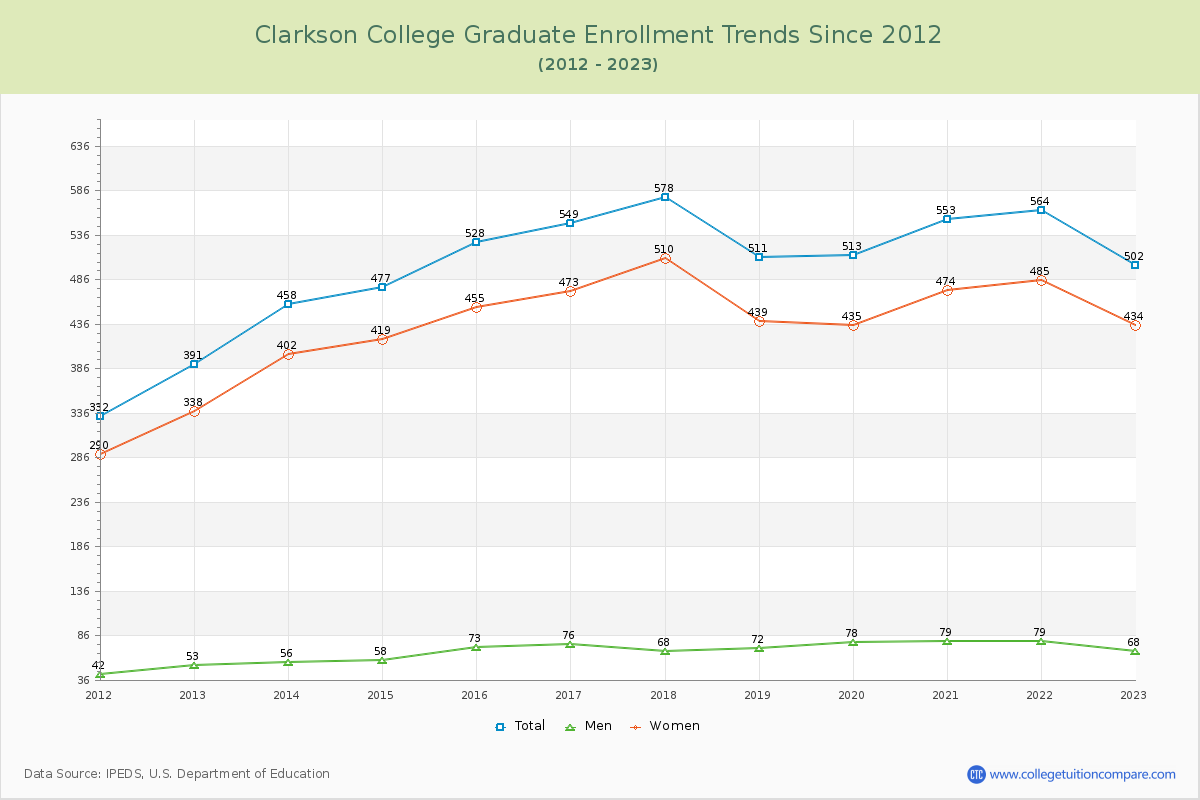
55.69% of total students is undergraduate students and 44.31% students is graduate students. The number of undergraduate students has decreased by 182 and the graduate enrollment has increased by 111 over past 10 years.
The female to male ratio is 6.13 to 1 and it means that there are far more female students enrolled in Clarkson than male students.
The following table and chart illustrate the changes in student population by gender at Clarkson College since 2012.
| Year | Total | Undergraduate | Graduate | ||||
|---|---|---|---|---|---|---|---|
| Total | Men | Women | Total | Men | Women | ||
| 2012-13 | 1,204 | 813 | 95 | 718 | 391 | 53 | 338 |
| 2013-14 | 1,238 34 | 780 -33 | 104 9 | 676 -42 | 458 67 | 56 3 | 402 64 |
| 2014-15 | 1,221 -17 | 744 -36 | 91 -13 | 653 -23 | 477 19 | 58 2 | 419 17 |
| 2015-16 | 1,254 33 | 726 -18 | 90 -1 | 636 -17 | 528 51 | 73 15 | 455 36 |
| 2016-17 | 1,219 -35 | 670 -56 | 78 -12 | 592 -44 | 549 21 | 76 3 | 473 18 |
| 2017-18 | 1,273 54 | 695 25 | 101 23 | 594 2 | 578 29 | 68 -8 | 510 37 |
| 2018-19 | 1,162 -111 | 651 -44 | 93 -8 | 558 -36 | 511 -67 | 72 4 | 439 -71 |
| 2019-20 | 1,108 -54 | 595 -56 | 99 6 | 496 -62 | 513 2 | 78 6 | 435 -4 |
| 2020-21 | 1,169 61 | 616 21 | 75 -24 | 541 45 | 553 40 | 79 1 | 474 39 |
| 2021-22 | 1,180 11 | 616 0 | 73 -2 | 543 2 | 564 11 | 79 0 | 485 11 |
| 2022-23 | 1,133 -47 | 631 15 | 91 18 | 540 -3 | 502 -62 | 68 -11 | 434 -51 |
| Average | 1,196 | 685 | 90 | 595 | 511 | 69 | 442 |