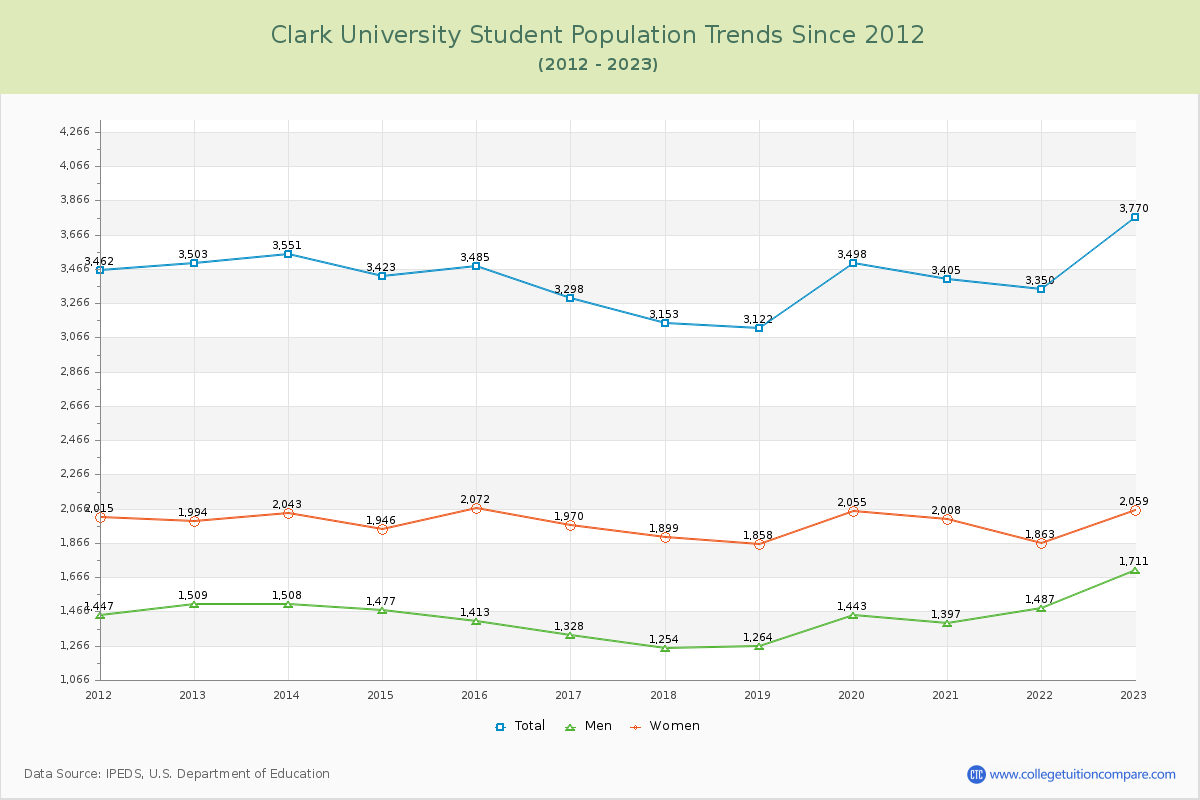
Student Population Changes
The average student population over the last 12 years is 3,414 where 3,770 students are attending the school for the academic year 2022-2023.
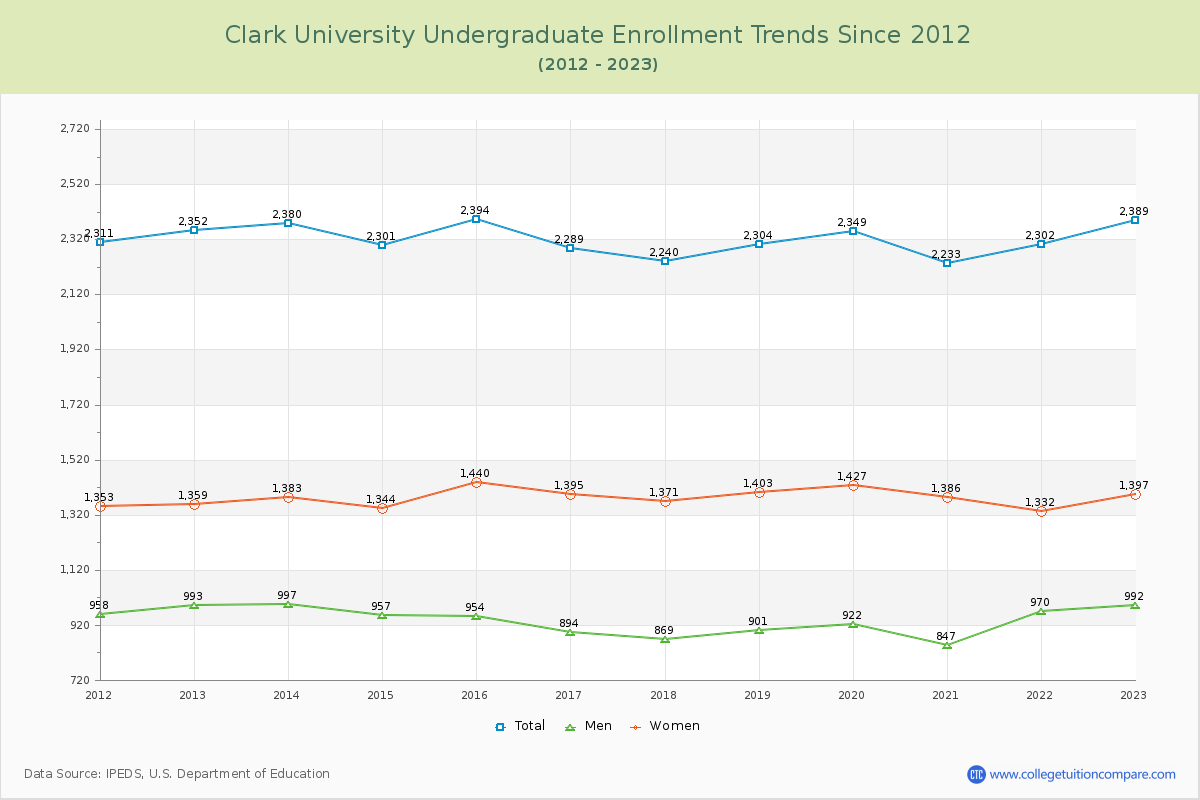
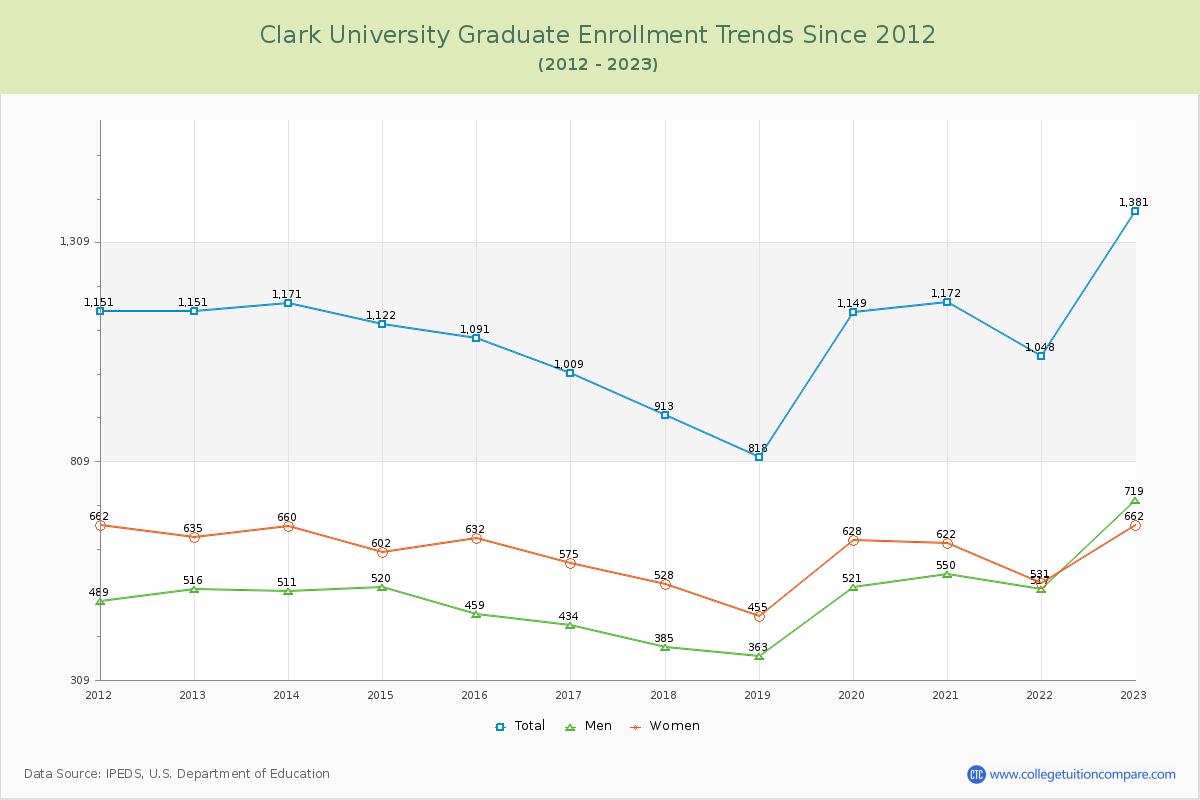
63.37% of total students is undergraduate students and 36.63% students is graduate students. The number of undergraduate students has increased by 37 and the graduate enrollment has increased by 230 over past 10 years.
The female to male ratio is 1.20 to 1 and it means that there are slightly more female students enrolled in Clark than male students.
The following table and chart illustrate the changes in student population by gender at Clark University since 2012.
| Year | Total | Undergraduate | Graduate | ||||
|---|---|---|---|---|---|---|---|
| Total | Men | Women | Total | Men | Women | ||
| 2012-13 | 3,503 | 2,352 | 993 | 1,359 | 1,151 | 516 | 635 |
| 2013-14 | 3,551 48 | 2,380 28 | 997 4 | 1,383 24 | 1,171 20 | 511 -5 | 660 25 |
| 2014-15 | 3,423 -128 | 2,301 -79 | 957 -40 | 1,344 -39 | 1,122 -49 | 520 9 | 602 -58 |
| 2015-16 | 3,485 62 | 2,394 93 | 954 -3 | 1,440 96 | 1,091 -31 | 459 -61 | 632 30 |
| 2016-17 | 3,298 -187 | 2,289 -105 | 894 -60 | 1,395 -45 | 1,009 -82 | 434 -25 | 575 -57 |
| 2017-18 | 3,153 -145 | 2,240 -49 | 869 -25 | 1,371 -24 | 913 -96 | 385 -49 | 528 -47 |
| 2018-19 | 3,122 -31 | 2,304 64 | 901 32 | 1,403 32 | 818 -95 | 363 -22 | 455 -73 |
| 2019-20 | 3,498 376 | 2,349 45 | 922 21 | 1,427 24 | 1,149 331 | 521 158 | 628 173 |
| 2020-21 | 3,405 -93 | 2,233 -116 | 847 -75 | 1,386 -41 | 1,172 23 | 550 29 | 622 -6 |
| 2021-22 | 3,350 -55 | 2,302 69 | 970 123 | 1,332 -54 | 1,048 -124 | 517 -33 | 531 -91 |
| 2022-23 | 3,770 420 | 2,389 87 | 992 22 | 1,397 65 | 1,381 333 | 719 202 | 662 131 |
| Average | 3,414 | 2,321 | 936 | 1,385 | 1,093 | 500 | 594 |