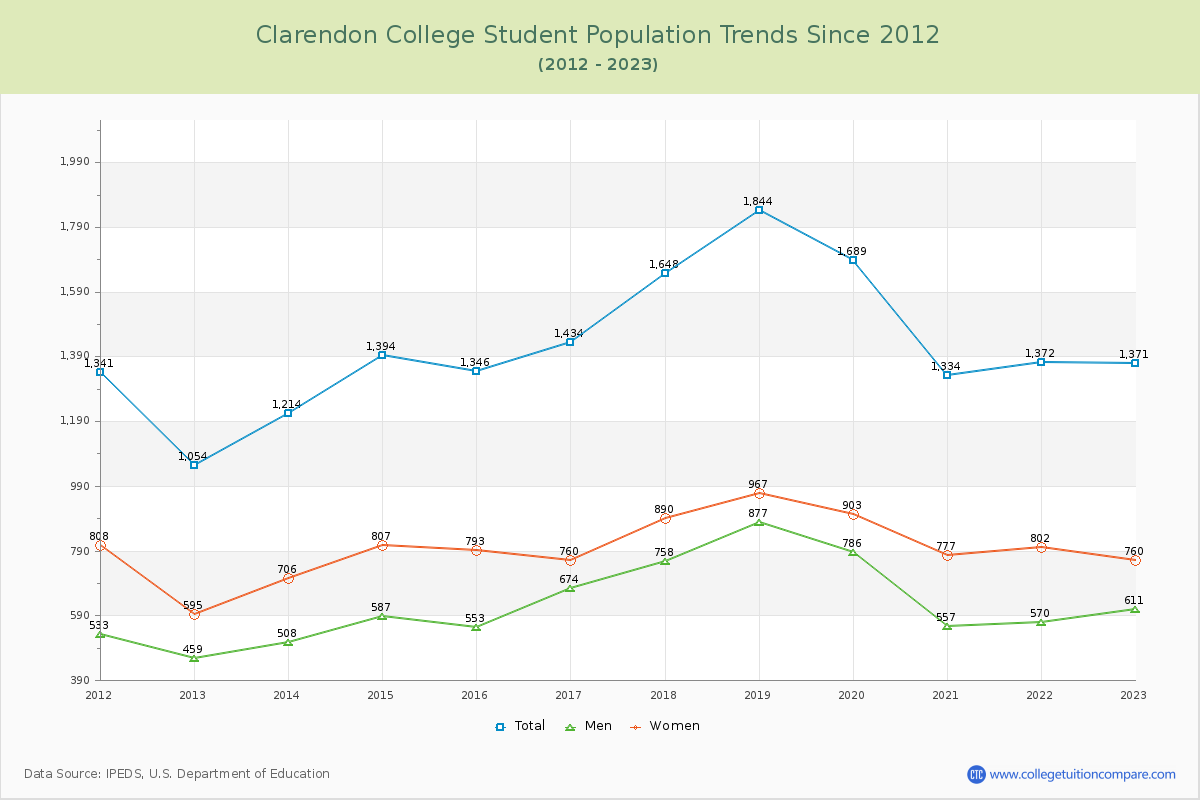
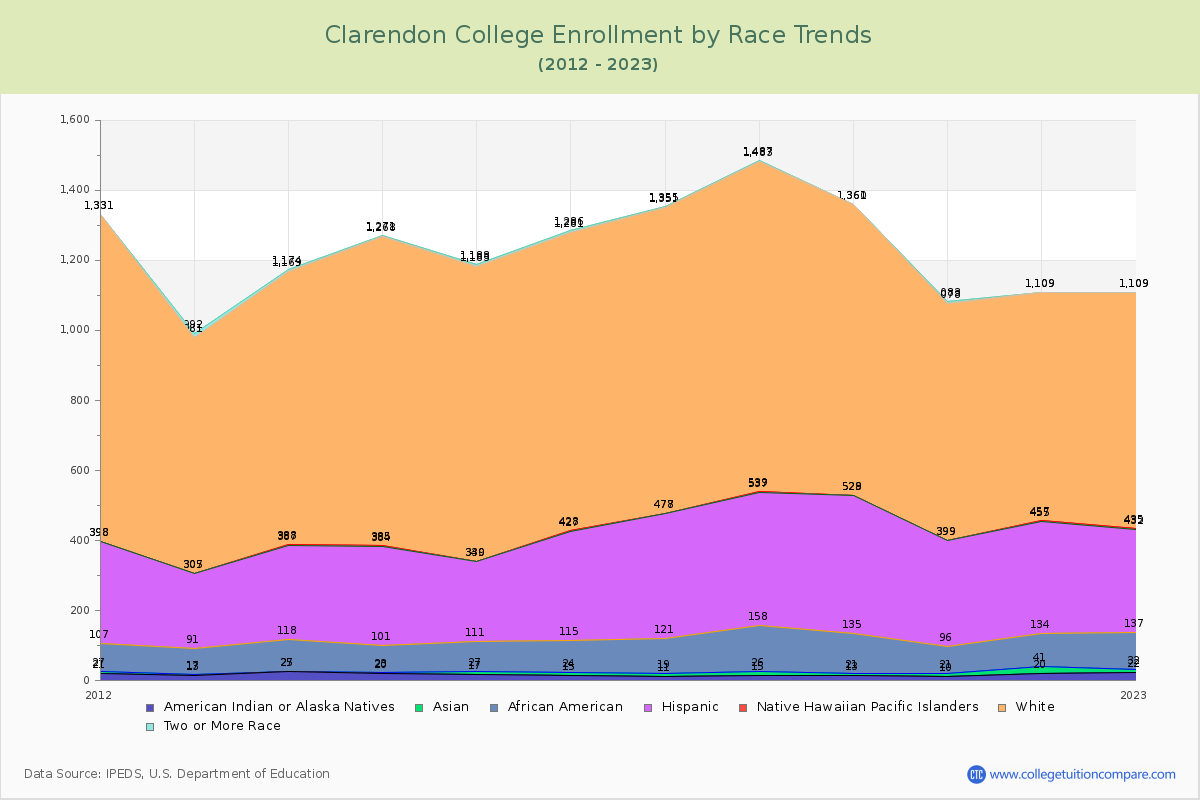
Student Population Changes
The average student population over the last 12 years is 1,427 where 1,371 students are attending the school for the academic year 2022-2023.
The female to male ratio is 1.24 to 1 and it means that there are slightly more female students enrolled in Clarendon than male students.
The following table and chart illustrate the changes in student population by gender at Clarendon College since 2012.
| Year | Total | Men | Women |
|---|---|---|---|
| 2012-13 | 1,054 | 459 | 595 |
| 2013-14 | 1,214 160 | 508 49 | 706 111 |
| 2014-15 | 1,394 180 | 587 79 | 807 101 |
| 2015-16 | 1,346 -48 | 553 -34 | 793 -14 |
| 2016-17 | 1,434 88 | 674 121 | 760 -33 |
| 2017-18 | 1,648 214 | 758 84 | 890 130 |
| 2018-19 | 1,844 196 | 877 119 | 967 77 |
| 2019-20 | 1,689 -155 | 786 -91 | 903 -64 |
| 2020-21 | 1,334 -355 | 557 -229 | 777 -126 |
| 2021-22 | 1,372 38 | 570 13 | 802 25 |
| 2022-23 | 1,371 -1 | 611 41 | 760 -42 |
| Average | 1,427 | 631 | 796 |