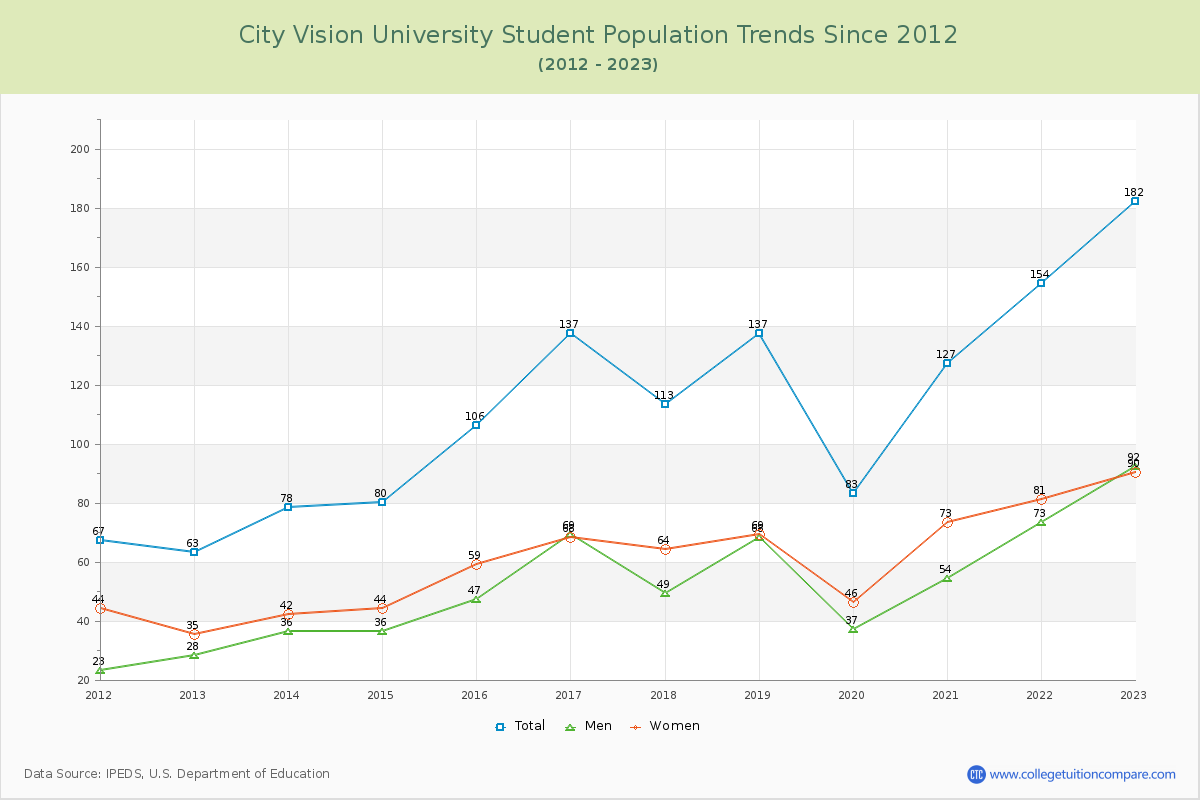
Student Population Changes
The average student population over the last 12 years is 115 where 182 students are attending the school for the academic year 2022-2023.
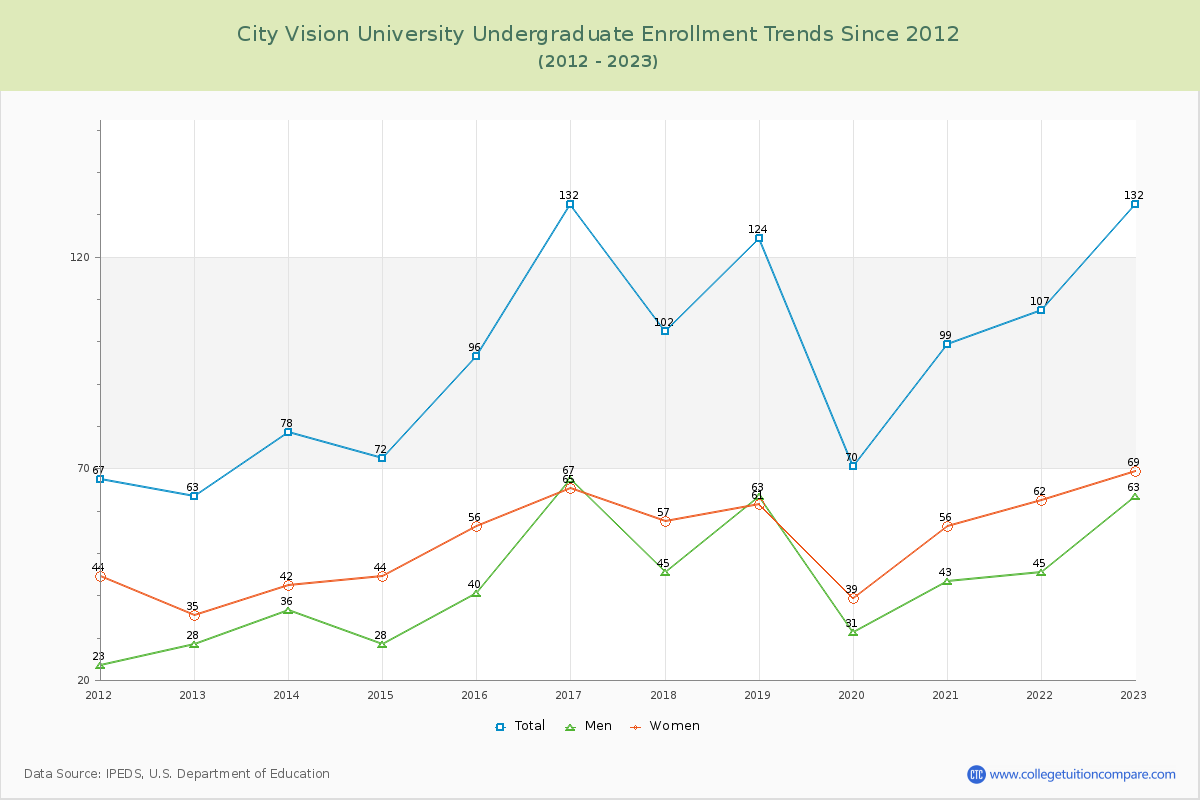
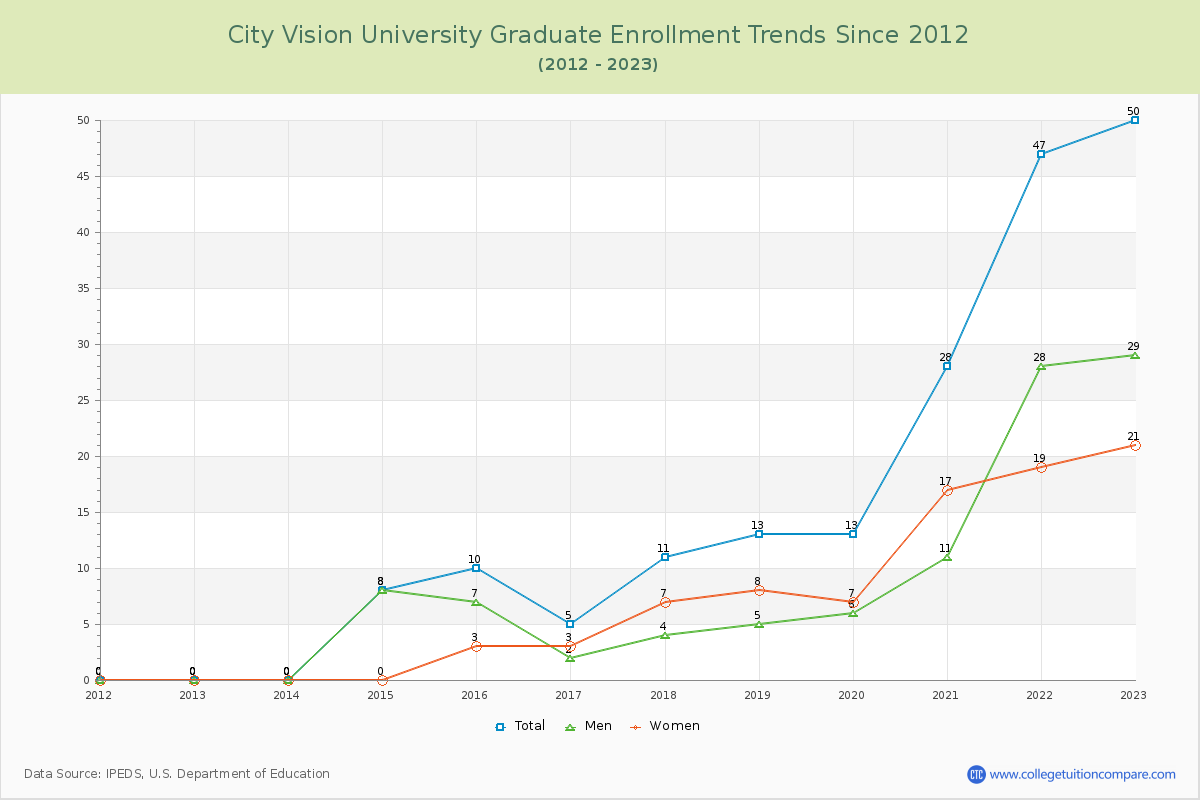
72.53% of total students is undergraduate students and 27.47% students is graduate students. The number of undergraduate students has increased by 69 and the graduate enrollment has increased by 50 over past 10 years.
The female to male ratio is 0.98 to 1 and it means that there are similar numbers of female and male students enrolled in City Vision.
The following table and chart illustrate the changes in student population by gender at City Vision University since 2012.
| Year | Total | Undergraduate | Graduate | ||||
|---|---|---|---|---|---|---|---|
| Total | Men | Women | Total | Men | Women | ||
| 2012-13 | 63 | 63 | 28 | 35 | 0 | 0 | 0 |
| 2013-14 | 78 15 | 78 15 | 36 8 | 42 7 | 0 0 | 0 0 | 0 0 |
| 2014-15 | 80 2 | 72 -6 | 28 -8 | 44 2 | 8 8 | 8 8 | 0 0 |
| 2015-16 | 106 26 | 96 24 | 40 12 | 56 12 | 10 2 | 7 -1 | 3 3 |
| 2016-17 | 137 31 | 132 36 | 67 27 | 65 9 | 5 -5 | 2 -5 | 3 0 |
| 2017-18 | 113 -24 | 102 -30 | 45 -22 | 57 -8 | 11 6 | 4 2 | 7 4 |
| 2018-19 | 137 24 | 124 22 | 63 18 | 61 4 | 13 2 | 5 1 | 8 1 |
| 2019-20 | 83 -54 | 70 -54 | 31 -32 | 39 -22 | 13 0 | 6 1 | 7 -1 |
| 2020-21 | 127 44 | 99 29 | 43 12 | 56 17 | 28 15 | 11 5 | 17 10 |
| 2021-22 | 154 27 | 107 8 | 45 2 | 62 6 | 47 19 | 28 17 | 19 2 |
| 2022-23 | 182 28 | 132 25 | 63 18 | 69 7 | 50 3 | 29 1 | 21 2 |
| Average | 115 | 98 | 44 | 53 | 17 | 9 | 8 |