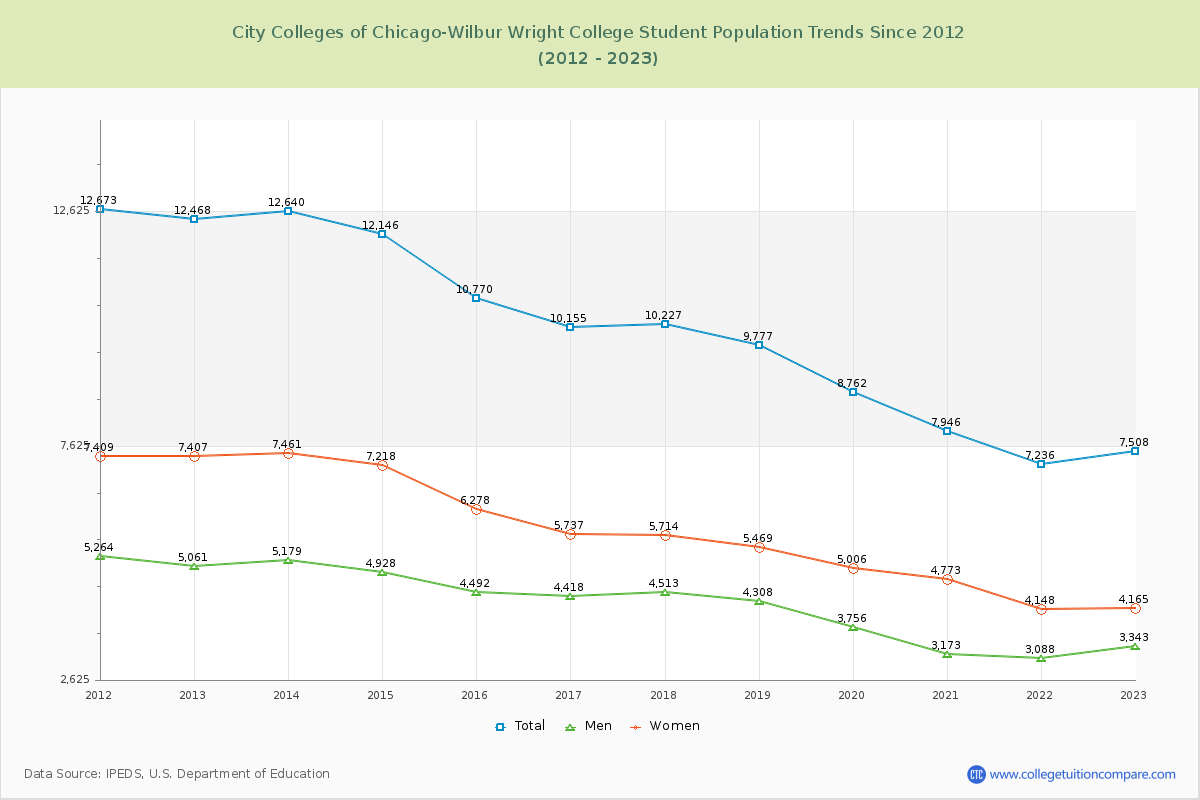
Student Population Changes
The average student population over the last 12 years is 9,967 where 7,508 students are attending the school for the academic year 2022-2023.
The female to male ratio is 1.25 to 1 and it means that there are slightly more female students enrolled in City Colleges of Chicago-Wilbur Wright than male students.
The following table and chart illustrate the changes in student population by gender at City Colleges of Chicago-Wilbur Wright College since 2012.
| Year | Total | Men | Women |
|---|---|---|---|
| 2012-13 | 12,468 | 5,061 | 7,407 |
| 2013-14 | 12,640 172 | 5,179 118 | 7,461 54 |
| 2014-15 | 12,146 -494 | 4,928 -251 | 7,218 -243 |
| 2015-16 | 10,770 -1,376 | 4,492 -436 | 6,278 -940 |
| 2016-17 | 10,155 -615 | 4,418 -74 | 5,737 -541 |
| 2017-18 | 10,227 72 | 4,513 95 | 5,714 -23 |
| 2018-19 | 9,777 -450 | 4,308 -205 | 5,469 -245 |
| 2019-20 | 8,762 -1,015 | 3,756 -552 | 5,006 -463 |
| 2020-21 | 7,946 -816 | 3,173 -583 | 4,773 -233 |
| 2021-22 | 7,236 -710 | 3,088 -85 | 4,148 -625 |
| 2022-23 | 7,508 272 | 3,343 255 | 4,165 17 |
| Average | 9,967 | 4,205 | 5,761 |