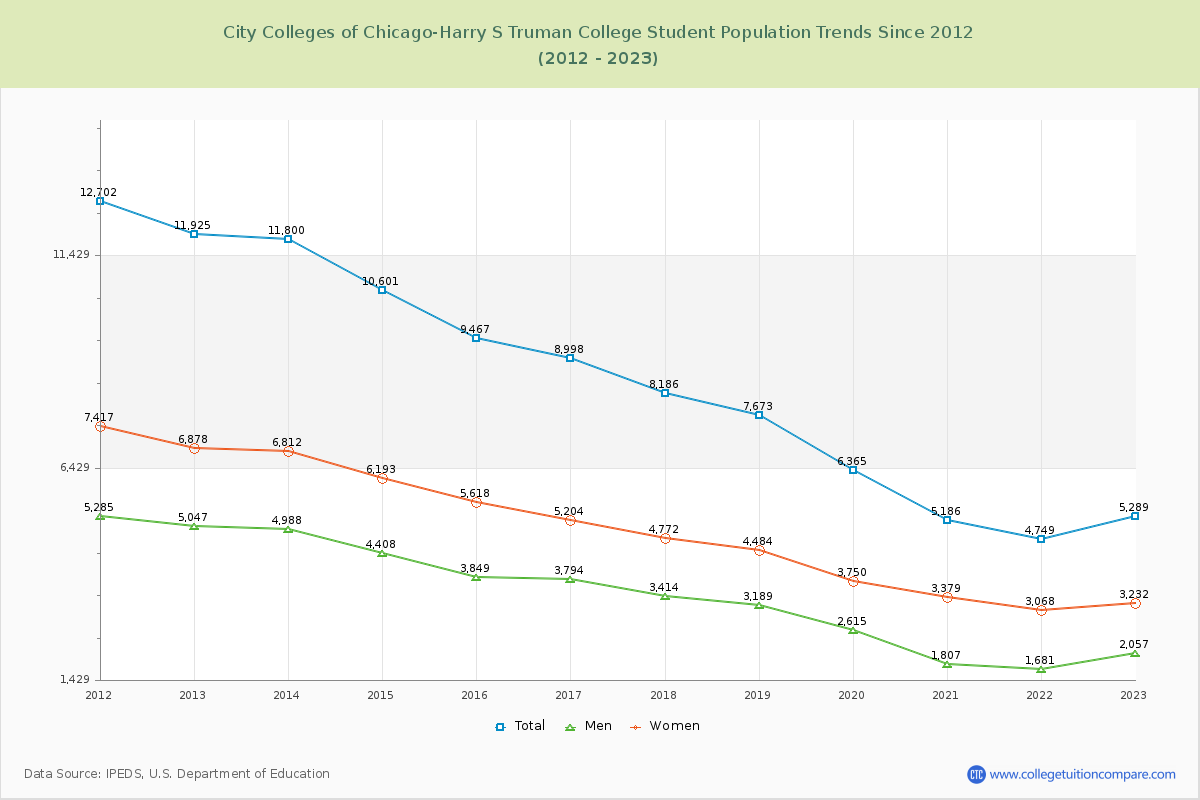
Student Population Changes
The average student population over the last 12 years is 8,204 where 5,289 students are attending the school for the academic year 2022-2023.
The female to male ratio is 1.57 to 1 and it means that there are more female students enrolled in City Colleges of Chicago-Harry S Truman than male students.
The following table and chart illustrate the changes in student population by gender at City Colleges of Chicago-Harry S Truman College since 2012.
| Year | Total | Men | Women |
|---|---|---|---|
| 2012-13 | 11,925 | 5,047 | 6,878 |
| 2013-14 | 11,800 -125 | 4,988 -59 | 6,812 -66 |
| 2014-15 | 10,601 -1,199 | 4,408 -580 | 6,193 -619 |
| 2015-16 | 9,467 -1,134 | 3,849 -559 | 5,618 -575 |
| 2016-17 | 8,998 -469 | 3,794 -55 | 5,204 -414 |
| 2017-18 | 8,186 -812 | 3,414 -380 | 4,772 -432 |
| 2018-19 | 7,673 -513 | 3,189 -225 | 4,484 -288 |
| 2019-20 | 6,365 -1,308 | 2,615 -574 | 3,750 -734 |
| 2020-21 | 5,186 -1,179 | 1,807 -808 | 3,379 -371 |
| 2021-22 | 4,749 -437 | 1,681 -126 | 3,068 -311 |
| 2022-23 | 5,289 540 | 2,057 376 | 3,232 164 |
| Average | 8,204 | 3,350 | 4,854 |