Enrollment Trends at CTC

53

Total Enrollment

-757

Men

810

Women

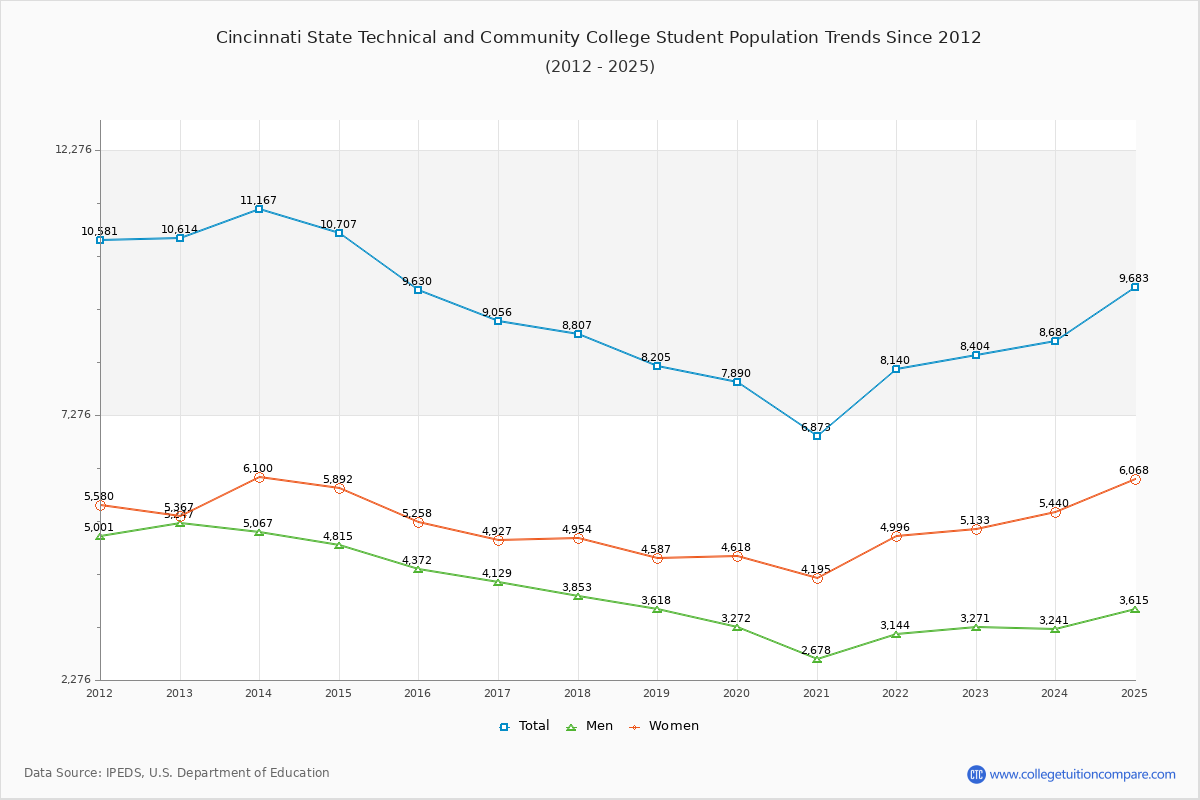
The student population at Cincinnati State Technical and Community College is 9,683 (all undergraduate). The number of students has increased by 53 over the past decade.

The female to male ratio is 1.68 to 1 which means that female students enrolled more than male students.

2,739 students enrolled in online degree program exclusively and the number of online students has increased by 217.75% since 2015.

Student Population Changes

The average student population over the last 11 years is 8,537 where 9,683 students are attending the school for the academic year 2024-2025.

The female to male ratio is 1.68 to 1 and it means that there are more female students enrolled in CTC than male students.

The following table and chart illustrate the changes in student population by gender at Cincinnati State Technical and Community College since 2015.

YearTotalMenWomen
2015-169,6304,3725,258
2016-179,056
-574
4,129
-243
4,927
-331
2017-188,807
-249
3,853
-276
4,954
27
2018-198,205
-602
3,618
-235
4,587
-367
2019-207,890
-315
3,272
-346
4,618
31
2020-216,873
-1,017
2,678
-594
4,195
-423
2021-228,140
1,267
3,144
466
4,996
801
2022-238,404
264
3,271
127
5,133
137
2023-248,681
277
3,241
-30
5,440
307
2024-259,683
1,002
3,615
374
6,068
628
Average8,5373,5195,018
Cincinnati State Technical and Community College Enrollment Trends Chart

Enrollment by Race/Ethnicity Changes

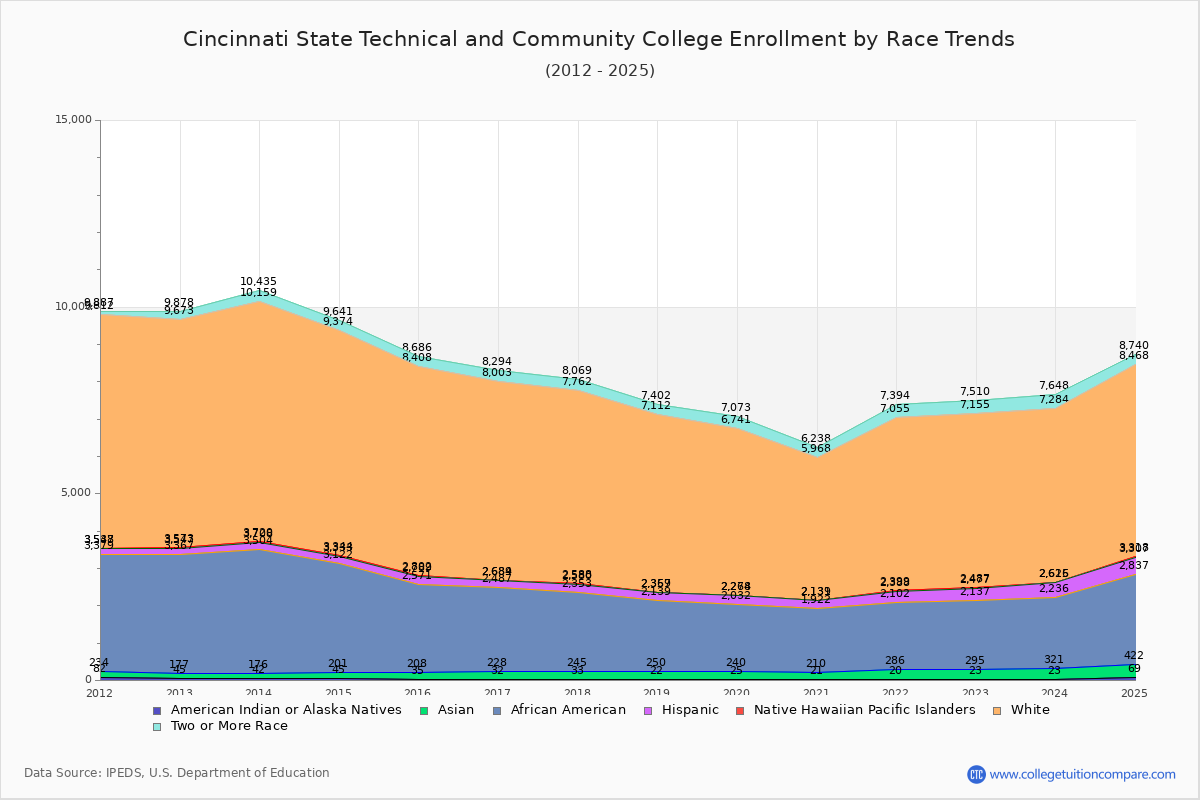
The percentage of white students is 53.19%. The percentage was 58.21% 10 years ago and CTC still has a high percentage of white students. 3.65% of enrolled students is Asian and 24.94% is black students. Hispanic students comprise 4.85% of the student body.

Over the past 10 years, the racial composition has shifted. The percentage of white students decreased from 58.21% to 53.19%. Asian enrollment grew from 1.80% to 3.65%. Black student enrollment increased from 24.54% to 24.94%. Hispanic student representation expanded from 2.26% to 4.85%.

The overall racial diversity, measured by the Census Bureau Diversity Index, is 0.6504 which indicates that moderately diverse. This increased from 0.5992 a decade ago, suggesting that racial diversity has improved.

The following table and chart illustrate the student population trends by race/ethnicity at Cincinnati State Technical and Community College over the past 11 years (2015-2025).

YearAmerican Indian or Native AmericanAsianBlackHispanicNative Hawaiian or Other Pacific IslanderWhiteTwo or More Races
2015-16351732,363218135,606278
2016-17321962,25919755,314291
2017-18332122,10822785,174307
2018-19222281,88922084,745290
2019-20252151,79223664,467332
2020-21211891,71220983,829270
2021-22202661,816286114,656339
2022-23232721,842340104,668355
2023-24232981,91538094,659364
2024-25693532,415470115,150272
Average302402,01127894,827310
Cincinnati State Technical and Community College Enrollment by Race Trends Chart

Distance Learning (Online Courses) Enrollment Changes

2,739 students are enrolled in online degree programs exclusively for the academic year 2024-2025, which is 28% of total students. The number of online students has increased 217.75% since 2015. The following table and chart illustrate the changes in the online student population by enrolled type at Cincinnati State Technical and Community College from 2015 to 2025.

YearTotal EnrollmentOnline CompletelyEnrolled in Some Online CoursesNot Enrolled in Online Courses
2015-169,6308622,0376,731
2016-179,0569032,9595,194
2017-188,8071,2723,2834,252
2018-198,2051,3112,2044,690
2019-207,8901,2612,1284,501
2020-216,8734,4291,636808
2021-228,1402,4382,2353,467
2022-238,4042,1792,3213,904
2023-248,6812,1682,3174,196
2024-259,6832,7392,4824,462
Average8,5371,9562,3604,221

Ratings & Review

Share your experiences and thoughts about Cincinnati State Technical and Community College. It will be a great help to applicants and prospective students!