Enrollment Trends at Christian Theological Seminary

-1

Total Enrollment

-14

Men

13

Women

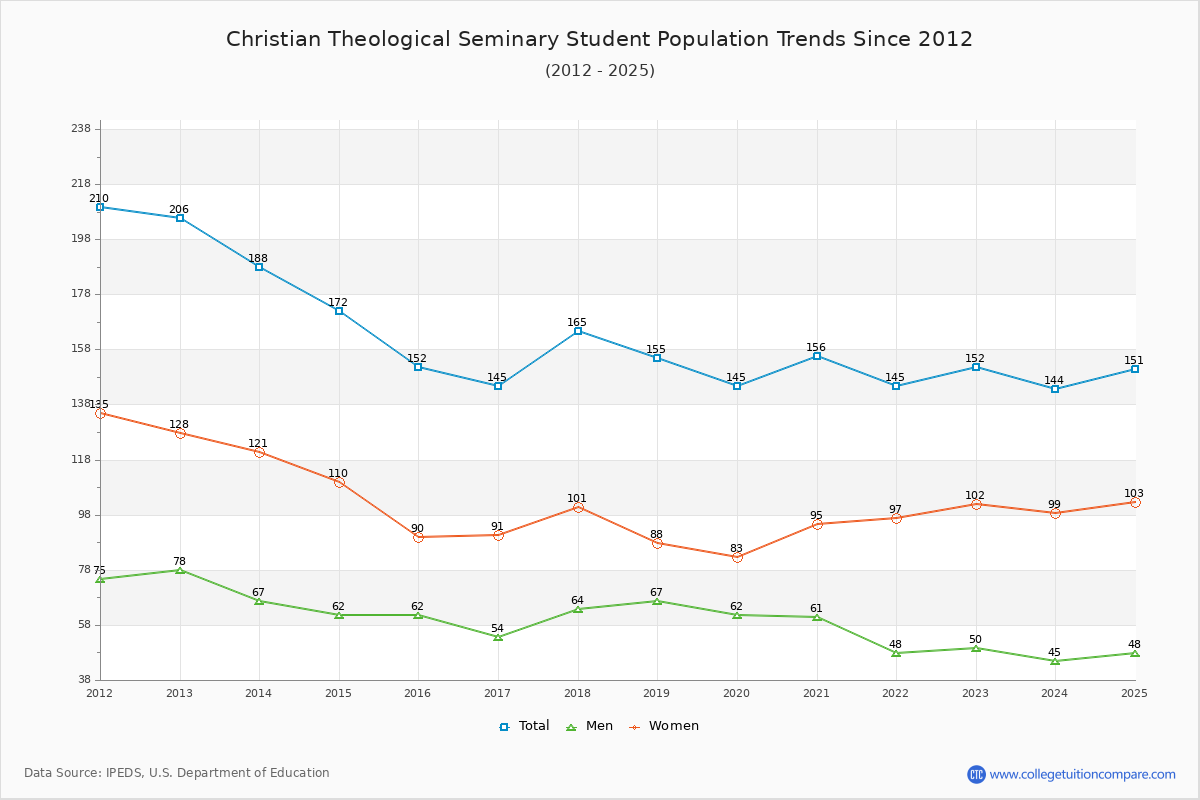
The student population at Christian Theological Seminary is 151 (all graduate). The number of students has decreased by 1 over the past decade.

The female to male ratio is 2.15 to 1 which means that majority of population is on female students.

30 students enrolled in online degree program exclusively and the number of online students has decreased by % since 2015.

Student Population Changes

The average student population over the last 11 years is 151 where 151 students are attending the school for the academic year 2024-2025.

The female to male ratio is 2.15 to 1 and it means that there are far more female students enrolled in Christian Theological Seminary than male students.

The following table and chart illustrate the changes in student population by gender at Christian Theological Seminary since 2015.

YearTotalMenWomen
2015-161526290
2016-17145
-7
54
-8
91
1
2017-18165
20
64
10
101
10
2018-19155
-10
67
3
88
-13
2019-20145
-10
62
-5
83
-5
2020-21156
11
61
-1
95
12
2021-22145
-11
48
-13
97
2
2022-23152
7
50
2
102
5
2023-24144
-8
45
-5
99
-3
2024-25151
7
48
3
103
4
Average1515695
Christian Theological Seminary Enrollment Trends Chart

Enrollment by Race/Ethnicity Changes

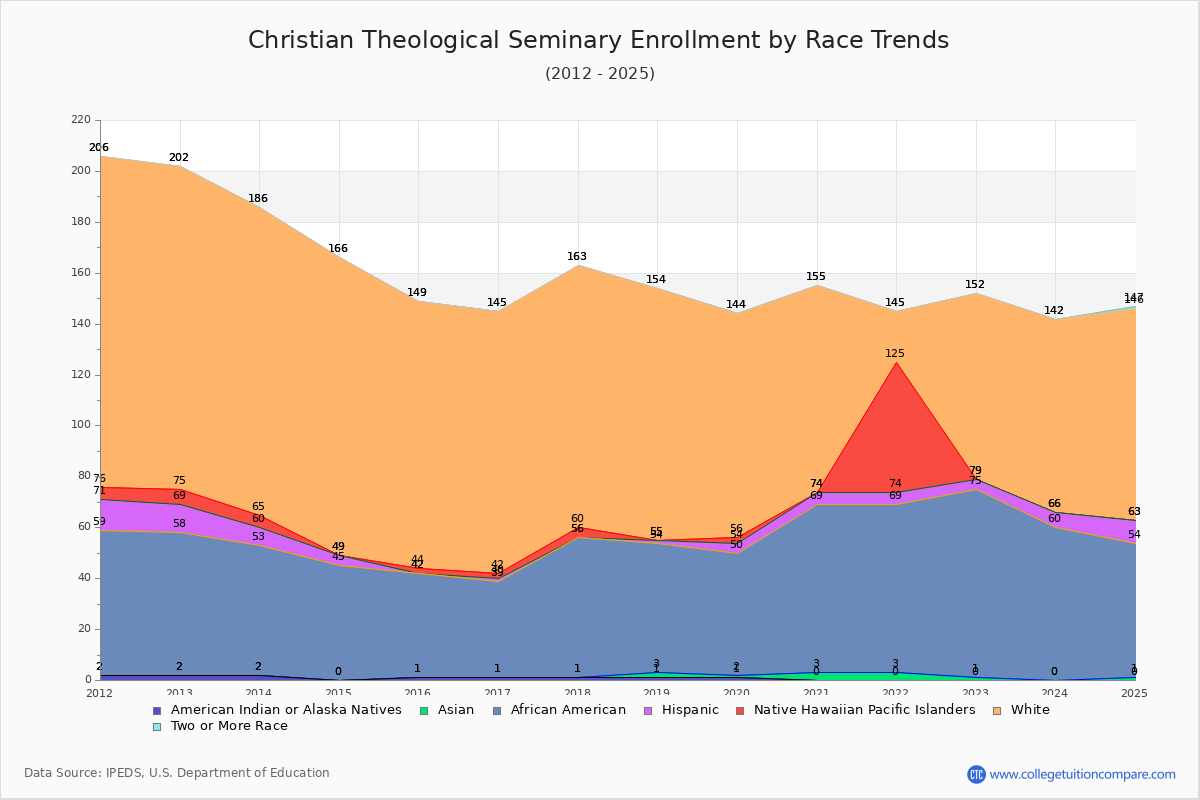
The percentage of white students is 54.97%. The percentage was 69.08% 10 years ago and Christian Theological Seminary still has a high percentage of white students. 0.66% of enrolled students is Asian and 35.10% is black students. Hispanic students comprise 5.96% of the student body.

Over the past 10 years, the racial composition has shifted. The percentage of white students decreased from 69.08% to 54.97%. Asian enrollment grew from 0.00% to 0.66%. Black student enrollment increased from 26.97% to 35.10%. Hispanic student representation expanded from 0.00% to 5.96%.

The overall racial diversity, measured by the Census Bureau Diversity Index, is 0.5710 which indicates that moderately diverse. This increased from 0.4498 a decade ago, suggesting that racial diversity has improved.

The following table and chart illustrate the student population trends by race/ethnicity at Christian Theological Seminary over the past 11 years (2015-2025).

YearAmerican Indian or Native AmericanAsianBlackHispanicNative Hawaiian or Other Pacific IslanderWhiteTwo or More Races
2015-161041021050
2016-171038121030
2017-181055041030
2018-19125110990
2019-20114842880
2020-21036650810
2021-220366551200
2022-23017440730
2023-24006060760
2024-25015390831
Average115546830
Christian Theological Seminary Enrollment by Race Trends Chart

Distance Learning (Online Courses) Enrollment Changes

30 students are enrolled in online degree programs exclusively for the academic year 2024-2025, which is 20% of total students. The number of online students has decreased % since 2015. The following table and chart illustrate the changes in the online student population by enrolled type at Christian Theological Seminary from 2015 to 2025.

YearTotal EnrollmentOnline CompletelyEnrolled in Some Online CoursesNot Enrolled in Online Courses
2015-1615200152
2016-1714508137
2017-1816509156
2018-19155519131
2019-20145025120
2020-2115615600
2021-2214501450
2022-2315201520
2023-24144113697
2024-25151304972
Average151204487

Ratings & Review

Share your experiences and thoughts about Christian Theological Seminary. It will be a great help to applicants and prospective students!