Applicants, Acceptance Rate, Yield Trends at Christian Brothers

-35.20%

Applicants - since 2015

40.73%

Acceptance Rate

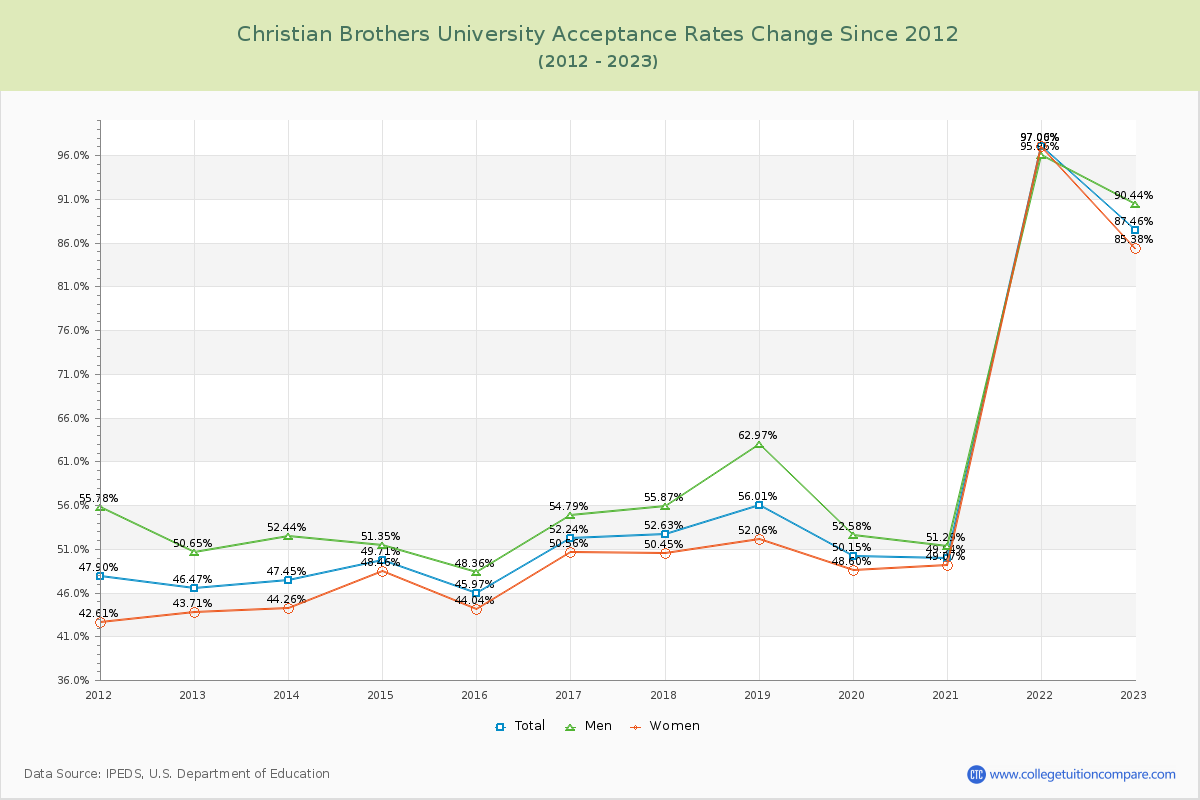
The average acceptance rate at Christian Brothers over the past 10 years is 66.65%, and the most recent acceptance rate is 86.70%.

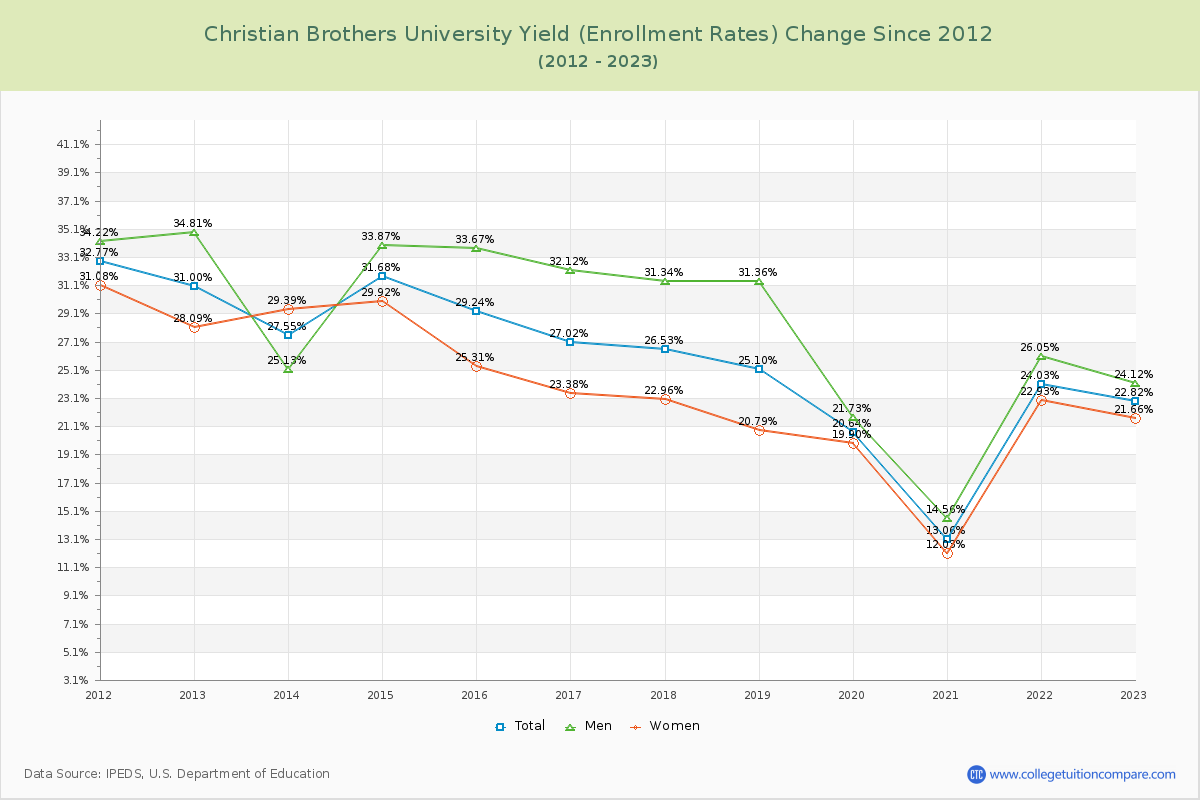
The average yield (enrollment rate) over the period is 22.23%, and the 2025 yield is 13.42%. Overall, the yield has decreased by 54.10% from 2015 to 2025.

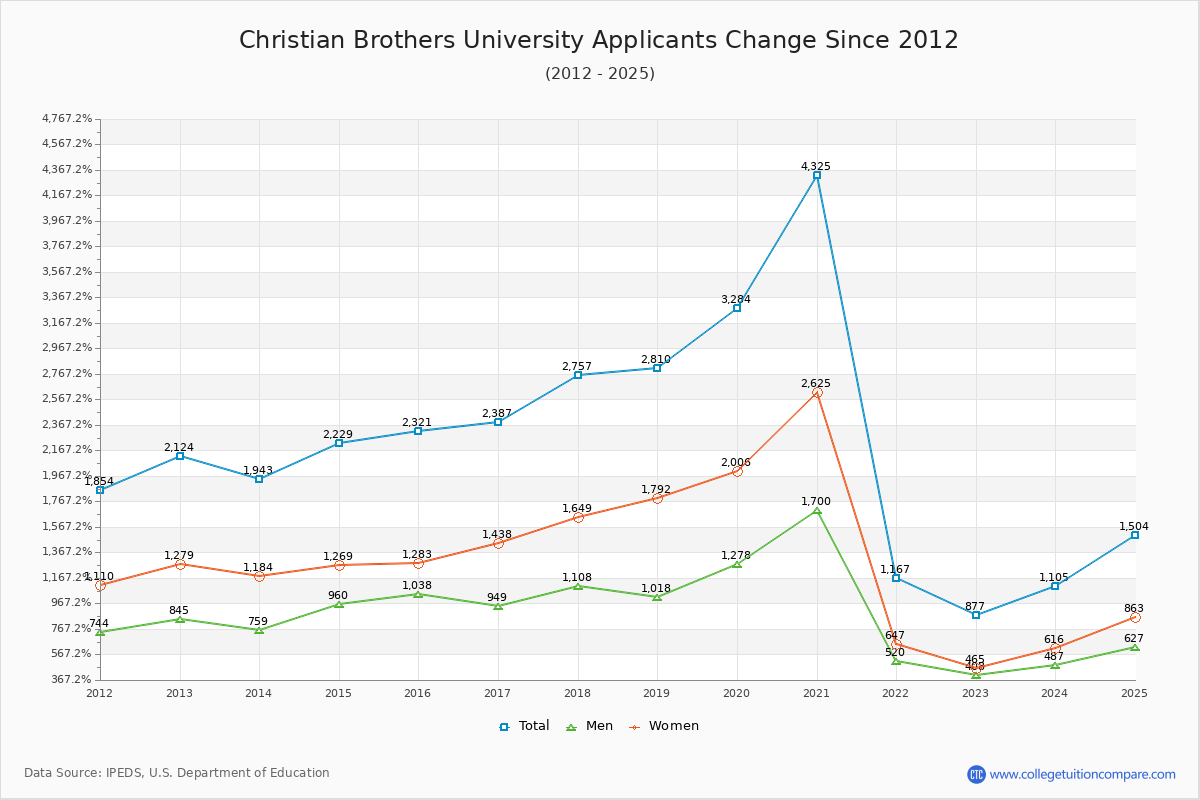
The number of Christian Brothers applicants increased by 36.11% (399 applicants) compared to the previous year. Over the entire 10-year period, applicants decreased by 35.20% overall.

Key Takeaways: Christian Brothers Admission Metrics

Acceptance Rate Overview

The current acceptance rate for the 2025 admission cycle is 86.70%, showing a decreasing selectivity trend. This suggests that Christian Brothers is admitting a higher proportion of applicants, which may indicate either an increase in application quality or a strategic enrollment decision by the institution.

Yield Rate & Enrollment Patterns

The admission yield (the percentage of admitted students who enroll) for the 2025 academic year is 13.42%. The declining yield trend suggests that a lower percentage of admitted students are choosing to enroll at Christian Brothers. This pattern may reflect increased competition from peer institutions, changing student demographics, or shifts in institutional enrollment strategy.

Application Volume & Admission Trends

For the 2025 admission cycle, Christian Brothers received approximately 1,504 applications, admitted 1,304 students, and enrolled 175 students. The declining application volume may indicate shifts in student interest patterns or broader demographic changes affecting college enrollment. Understanding these trends is crucial for prospective students and families assessing Christian Brothers's position in the competitive admissions landscape.

Acceptance Rate Changes

Christian Brothers 10-Year Admission Rate Summary: The acceptance rate trends at Christian Brothers over the past decade show a relatively stable trend, with fluctuations in both directions. The average acceptance rate over this period is 66.65%, while the most recent rate stands at 86.70%. This data reflects the institution's evolving competitiveness in the higher education admissions landscape.

For the most recent admission cycle (2025), the acceptance rate is 86.70%. By gender, the average acceptance rate for men is 68.86% and for women is 65.12%.

The following table and chart show how acceptance rates at Christian Brothers have changed over the past 10 years (2015-2025).

YearTotalMenWomen
2015-16 45.97% 48.36% 44.04%
2016-17 52.24%
6.27%
54.79%
6.43%
50.56%
6.52%
2017-18 52.63%
0.39%
55.87%
1.07%
50.45%
-0.10%
2018-19 56.01%
3.38%
62.97%
7.10%
52.06%
1.61%
2019-20 50.15%
-5.86%
52.58%
-10.38%
48.60%
-3.46%
2020-21 49.94%
-0.21%
51.29%
-1.29%
49.07%
0.46%
2021-22 97.00%
47.06%
95.96%
44.67%
97.06%
48.00%
2022-23 87.46%
-9.54%
90.44%
-5.52%
85.38%
-11.69%
2023-24 88.42%
0.96%
88.91%
-1.53%
87.99%
2.61%
2024-25 86.70%
-1.71%
87.40%
-1.51%
85.98%
-2.01%
Average 66.65% 68.86% 65.12%
Christian Brothers University Acceptance Rate Trends Over Time - Historical Admission Rate Data Visualization Chart

Admission Yield (Enrollment Rate) Changes

Christian Brothers has demonstrated a decline in admission yield over the past 10 years. The institution's yield rate has decreased from 29.24% in 2015 to 13.42% in 2025, representing a 54.10% decrease. The 10-year average yield stands at 22.23%, reflecting weakening enrollment performance.

The following table and chart illustrate the changes in yield at Christian Brothers from 2015 to 2025. The admission yield has decreased by 54.10% over this period.

YearTotalMenWomen
2015-16 29.24% 33.67% 25.31%
2016-17 27.02%
-2.22%
32.12%
-1.55%
23.38%
-1.93%
2017-18 26.53%
-0.49%
31.34%
-0.77%
22.96%
-0.43%
2018-19 25.10%
-1.44%
31.36%
0.02%
20.79%
-2.16%
2019-20 20.64%
-4.45%
21.73%
-9.63%
19.90%
-0.90%
2020-21 13.06%
-7.59%
14.56%
-7.16%
12.03%
-7.86%
2021-22 24.03%
10.97%
26.05%
11.49%
22.93%
10.90%
2022-23 22.82%
-1.21%
24.12%
-1.93%
21.66%
-1.27%
2023-24 20.47%
-2.35%
19.40%
-4.72%
21.40%
-0.26%
2024-25 13.42%
-7.05%
18.25%
-1.15%
10.11%
-11.29%
Average 22.23% 25.26% 20.05%
Christian Brothers University enrollment rate trends chart showing historical yield changes from 2015 to 2025

Applicants, Admitted, and Enrolled Headcount Changes

Over the past 10 years, The average number of applicants is 2,254, the average number of admitted is 1,333, and the average number of first-year enrolled students is 287.

The number of Christian Brothers applicants increased by 36.11% (399 applicants) compared to the previous year. Over the entire 10-year period, applicants decreased by 35.20% overall.

The following table and chart show the changes of applicants, admitted, and enrolled headcount at Christian Brothers University from 2015 to 2025.

YearApplicantsAdmittedEnrolled
2015-16 2,321 1,067 312
2016-17 2,387
2.84%
1,247
16.87%
337
8.01%
2017-18 2,757
15.50%
1,451
16.36%
385
14.24%
2018-19 2,810
1.92%
1,574
8.48%
395
2.60%
2019-20 3,284
16.87%
1,647
4.64%
340
-13.92%
2020-21 4,325
31.70%
2,160
31.15%
282
-17.06%
2021-22 1,167
-73.02%
1,132
-47.59%
272
-3.55%
2022-23 877
-24.85%
767
-32.24%
175
-35.66%
2023-24 1,105
26.00%
977
27.38%
200
14.29%
2024-25 1,504
36.11%
1,304
33.47%
175
-12.50%
Average 2,254 1,333 287
Christian Brothers University - 10 Year Applicants, Admissions, and Enrollment Trends Chart

Compare Acceptance Rate Change to Similar Colleges

The following table compares Christian Brothers University' acceptance rate to similar schools.

20242025Change %
Christian Brothers University88.42%86.70%-1.95%
Vanderbilt University5.86%6.28%-6.69%
Belmont University95.28%96.36%-1.12%
Lincoln Memorial University62.59%59.27%5.60%
Lipscomb University67.73%66.64%1.64%
Lee University70.52%72.19%-2.31%

Ratings & Review

Share your experiences and thoughts about Christian Brothers University. It will be a great help to applicants and prospective students!