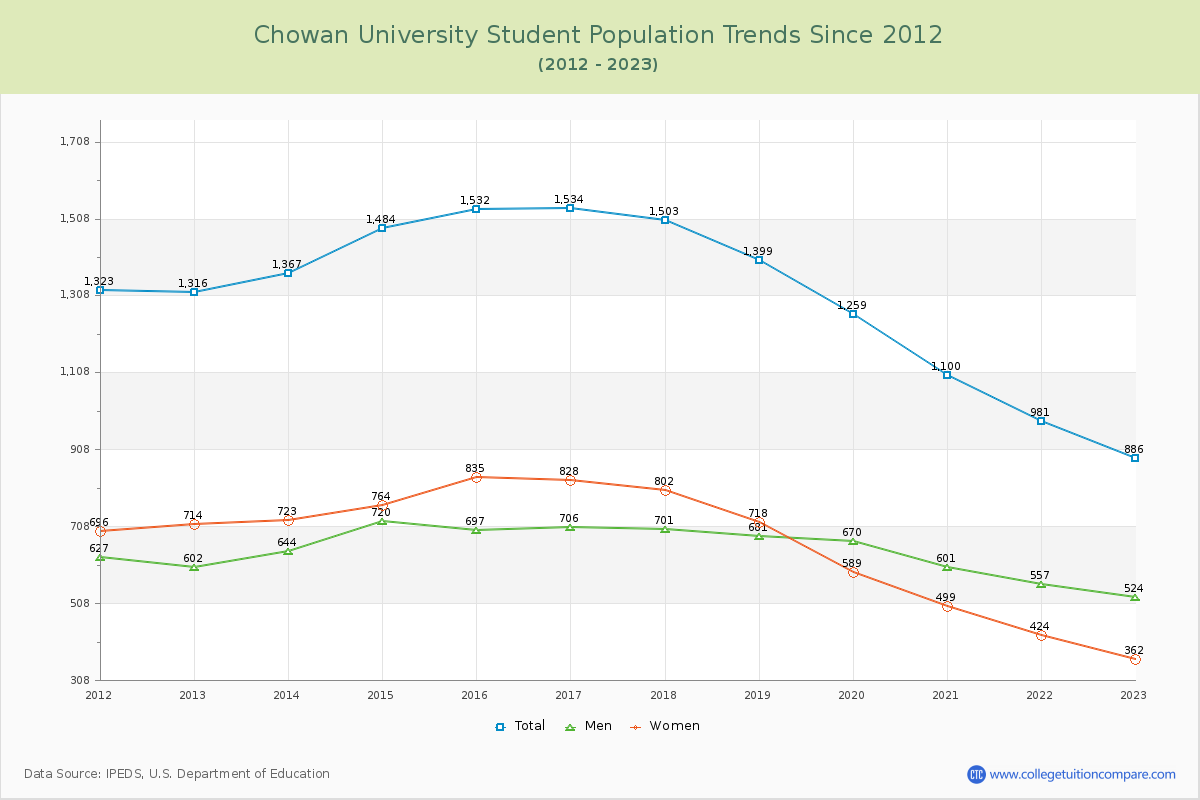
Student Population Changes
The average student population over the last 12 years is 1,306 where 886 students are attending the school for the academic year 2022-2023.
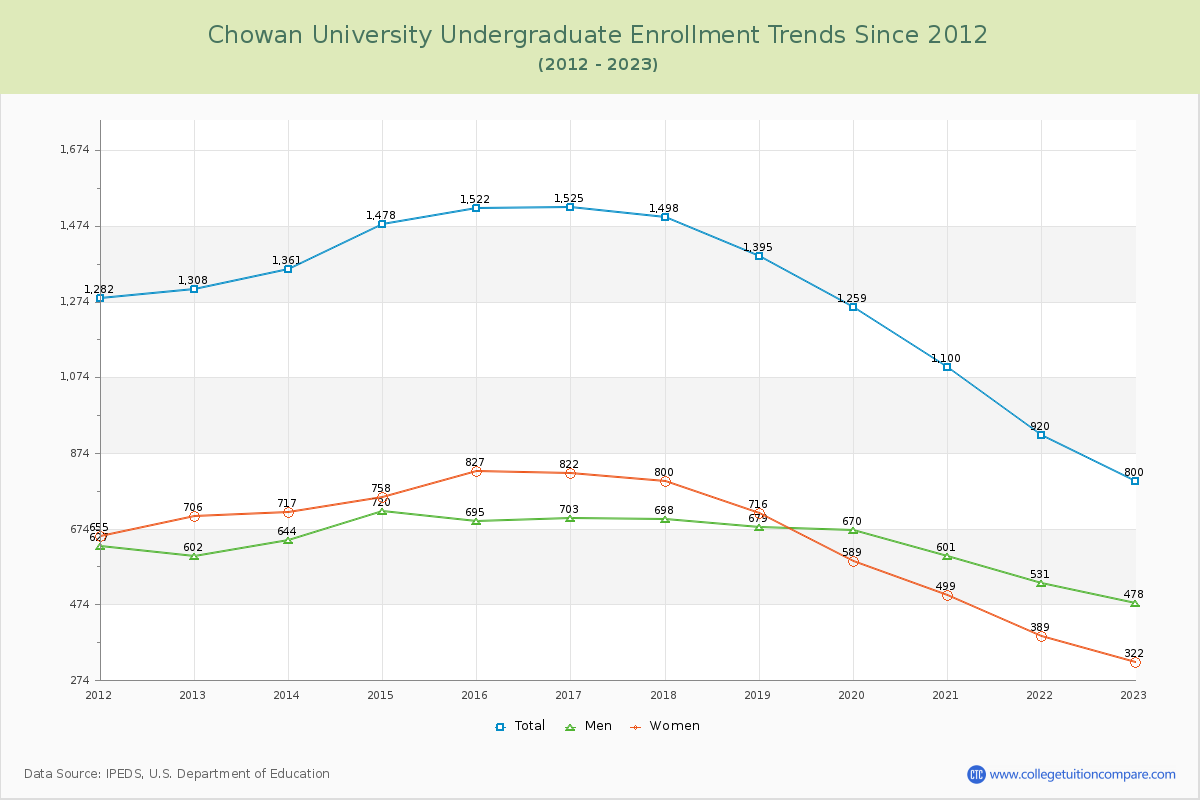
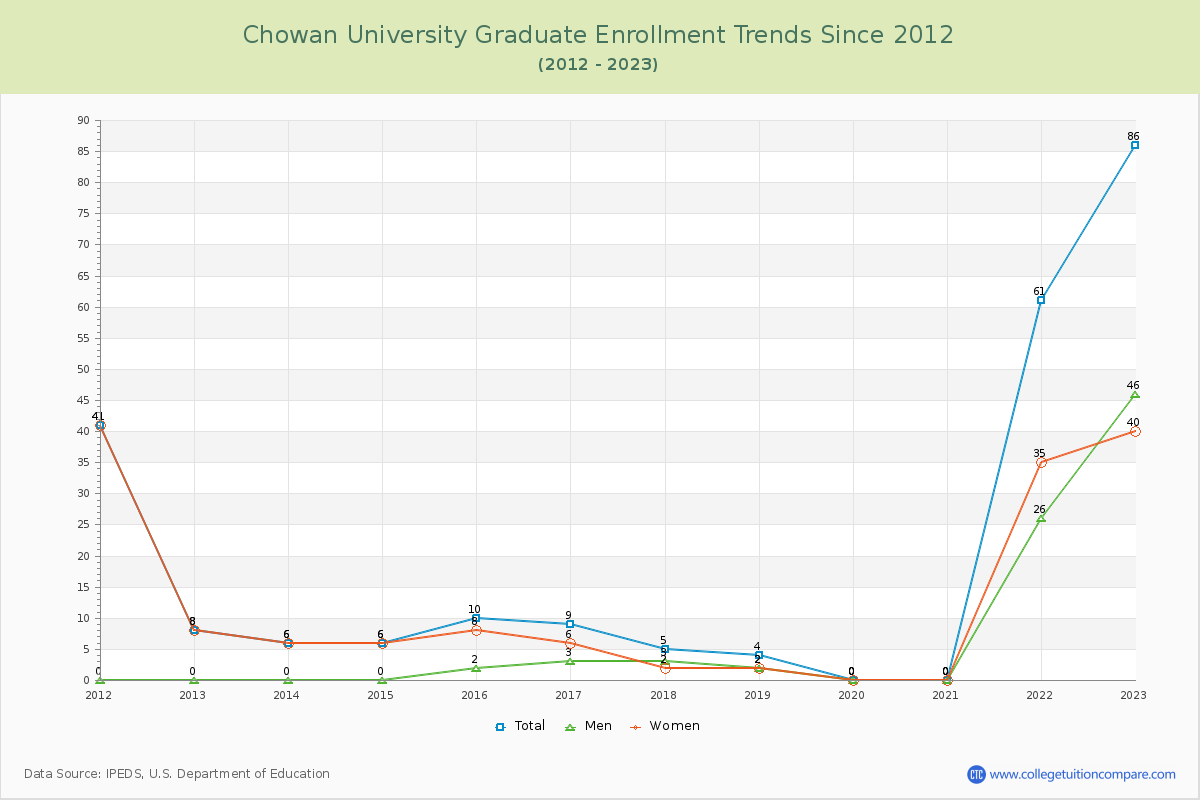
90.29% of total students is undergraduate students and 9.71% students is graduate students. The number of undergraduate students has decreased by 508 and the graduate enrollment has increased by 78 over past 10 years.
The female to male ratio is 0.69 to 1 and it means that there are more male students enrolled in Chowan than female students.
The following table and chart illustrate the changes in student population by gender at Chowan University since 2012.
| Year | Total | Undergraduate | Graduate | ||||
|---|---|---|---|---|---|---|---|
| Total | Men | Women | Total | Men | Women | ||
| 2012-13 | 1,316 | 1,308 | 602 | 706 | 8 | 0 | 8 |
| 2013-14 | 1,367 51 | 1,361 53 | 644 42 | 717 11 | 6 -2 | 0 0 | 6 -2 |
| 2014-15 | 1,484 117 | 1,478 117 | 720 76 | 758 41 | 6 0 | 0 0 | 6 0 |
| 2015-16 | 1,532 48 | 1,522 44 | 695 -25 | 827 69 | 10 4 | 2 2 | 8 2 |
| 2016-17 | 1,534 2 | 1,525 3 | 703 8 | 822 -5 | 9 -1 | 3 1 | 6 -2 |
| 2017-18 | 1,503 -31 | 1,498 -27 | 698 -5 | 800 -22 | 5 -4 | 3 0 | 2 -4 |
| 2018-19 | 1,399 -104 | 1,395 -103 | 679 -19 | 716 -84 | 4 -1 | 2 -1 | 2 0 |
| 2019-20 | 1,259 -140 | 1,259 -136 | 670 -9 | 589 -127 | 0 -4 | 0 -2 | 0 -2 |
| 2020-21 | 1,100 -159 | 1,100 -159 | 601 -69 | 499 -90 | 0 0 | 0 0 | 0 0 |
| 2021-22 | 981 -119 | 920 -180 | 531 -70 | 389 -110 | 61 61 | 26 26 | 35 35 |
| 2022-23 | 886 -95 | 800 -120 | 478 -53 | 322 -67 | 86 25 | 46 20 | 40 5 |
| Average | 1,306 | 1,288 | 638 | 650 | 18 | 7 | 10 |