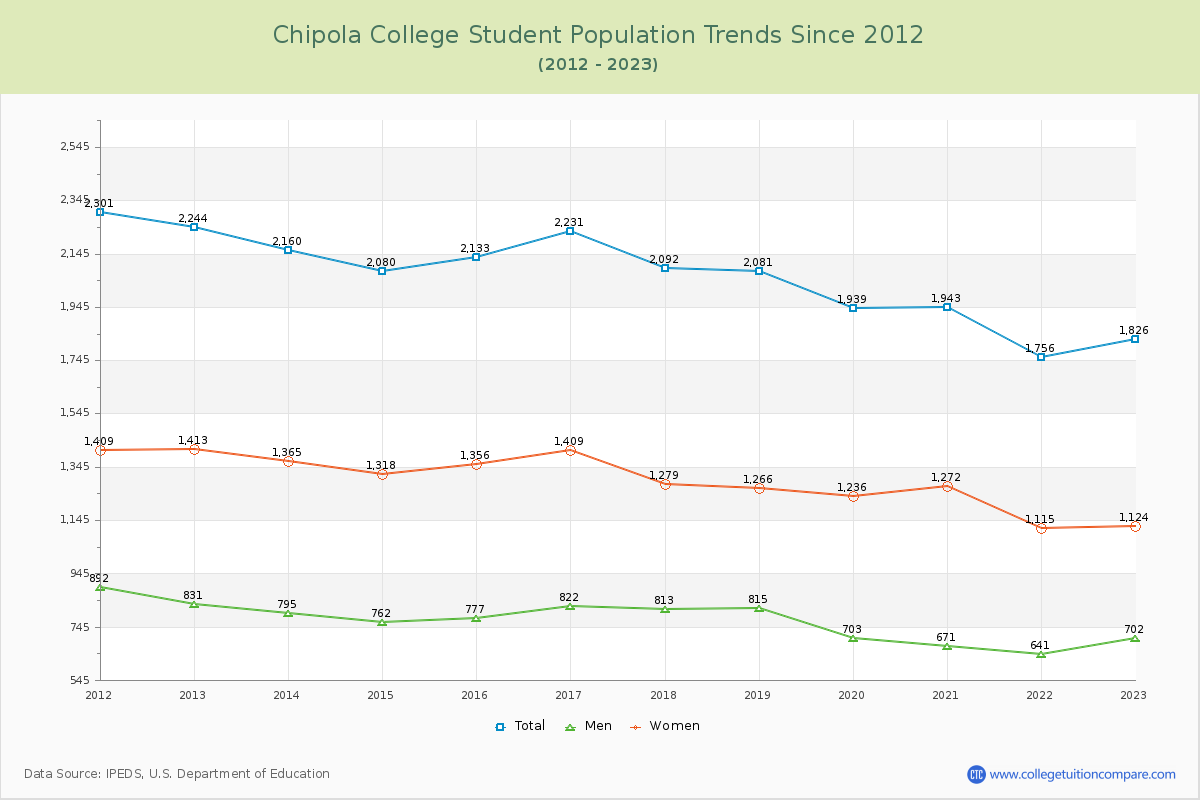
Student Population Changes
The average student population over the last 12 years is 2,044 where 1,826 students are attending the school for the academic year 2022-2023.
The female to male ratio is 1.60 to 1 and it means that there are more female students enrolled in CJC than male students.
The following table and chart illustrate the changes in student population by gender at Chipola College since 2012.
| Year | Total | Men | Women |
|---|---|---|---|
| 2012-13 | 2,244 | 831 | 1,413 |
| 2013-14 | 2,160 -84 | 795 -36 | 1,365 -48 |
| 2014-15 | 2,080 -80 | 762 -33 | 1,318 -47 |
| 2015-16 | 2,133 53 | 777 15 | 1,356 38 |
| 2016-17 | 2,231 98 | 822 45 | 1,409 53 |
| 2017-18 | 2,092 -139 | 813 -9 | 1,279 -130 |
| 2018-19 | 2,081 -11 | 815 2 | 1,266 -13 |
| 2019-20 | 1,939 -142 | 703 -112 | 1,236 -30 |
| 2020-21 | 1,943 4 | 671 -32 | 1,272 36 |
| 2021-22 | 1,756 -187 | 641 -30 | 1,115 -157 |
| 2022-23 | 1,826 70 | 702 61 | 1,124 9 |
| Average | 2,044 | 757 | 1,287 |