Student Population Changes
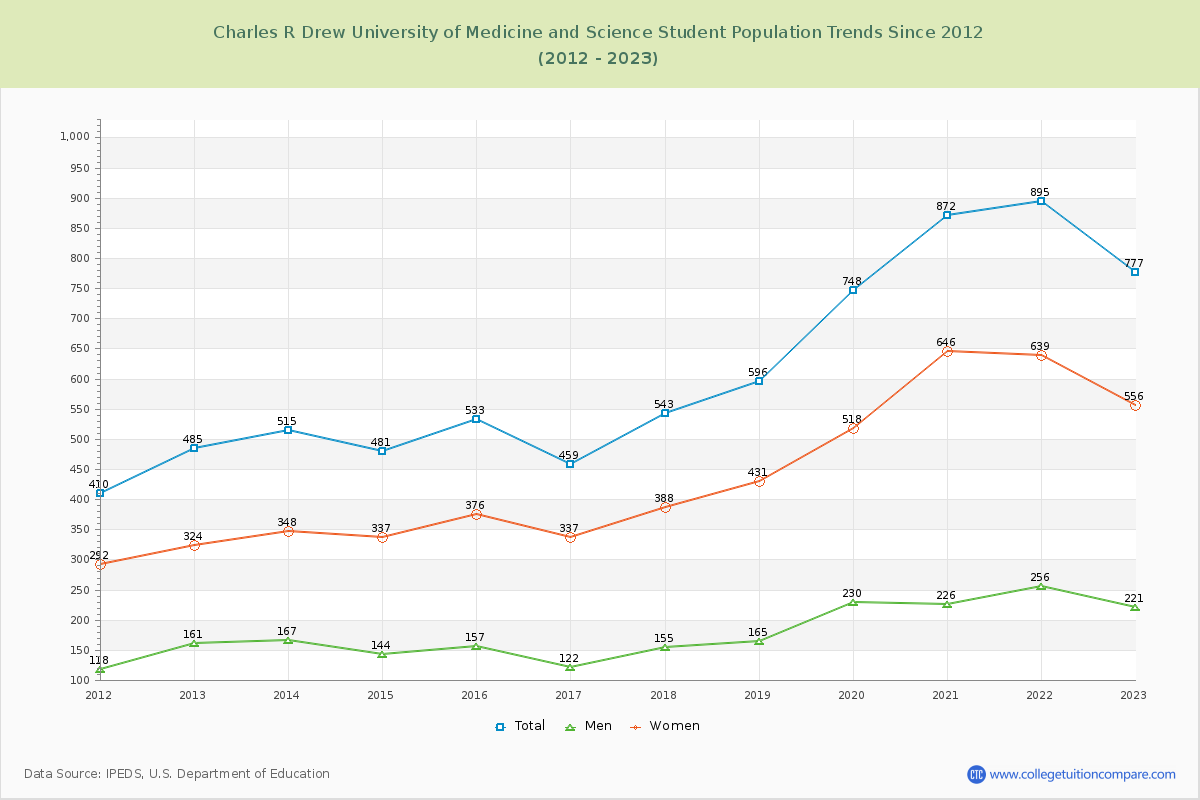
The average student population over the last 12 years is 628 where 777 students are attending the school for the academic year 2022-2023.
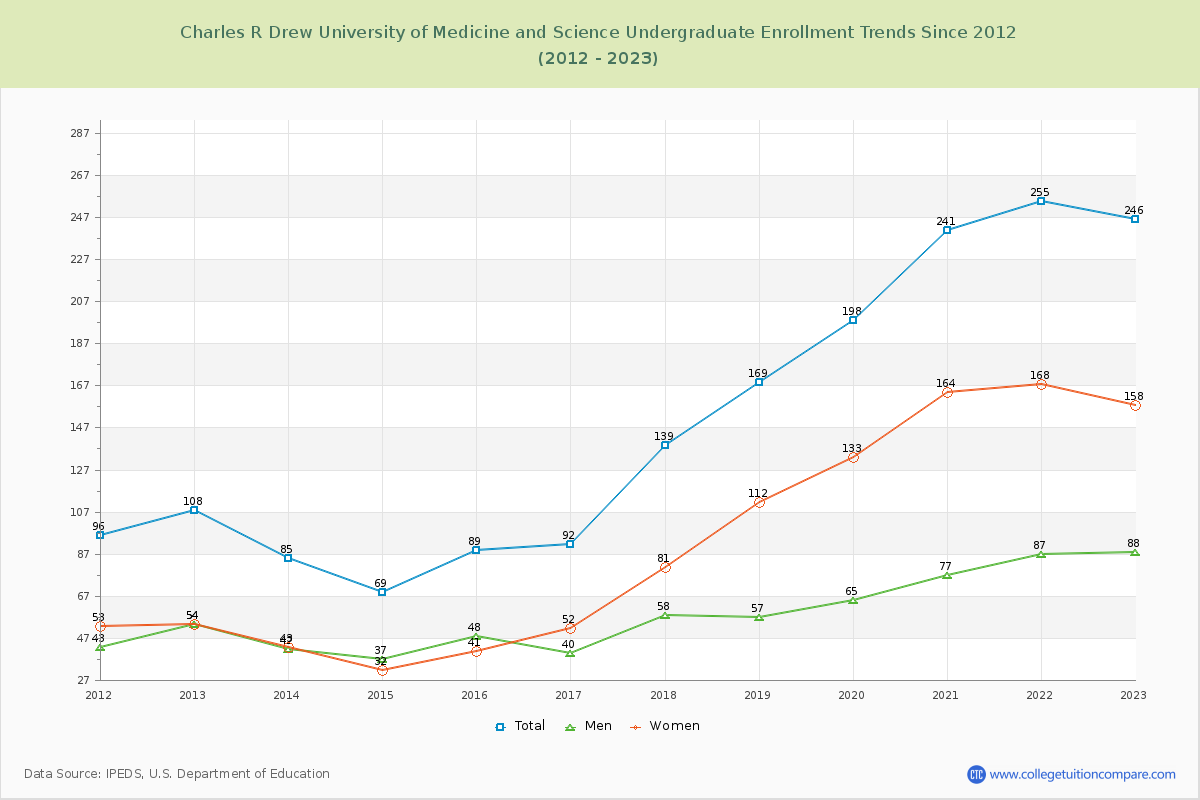
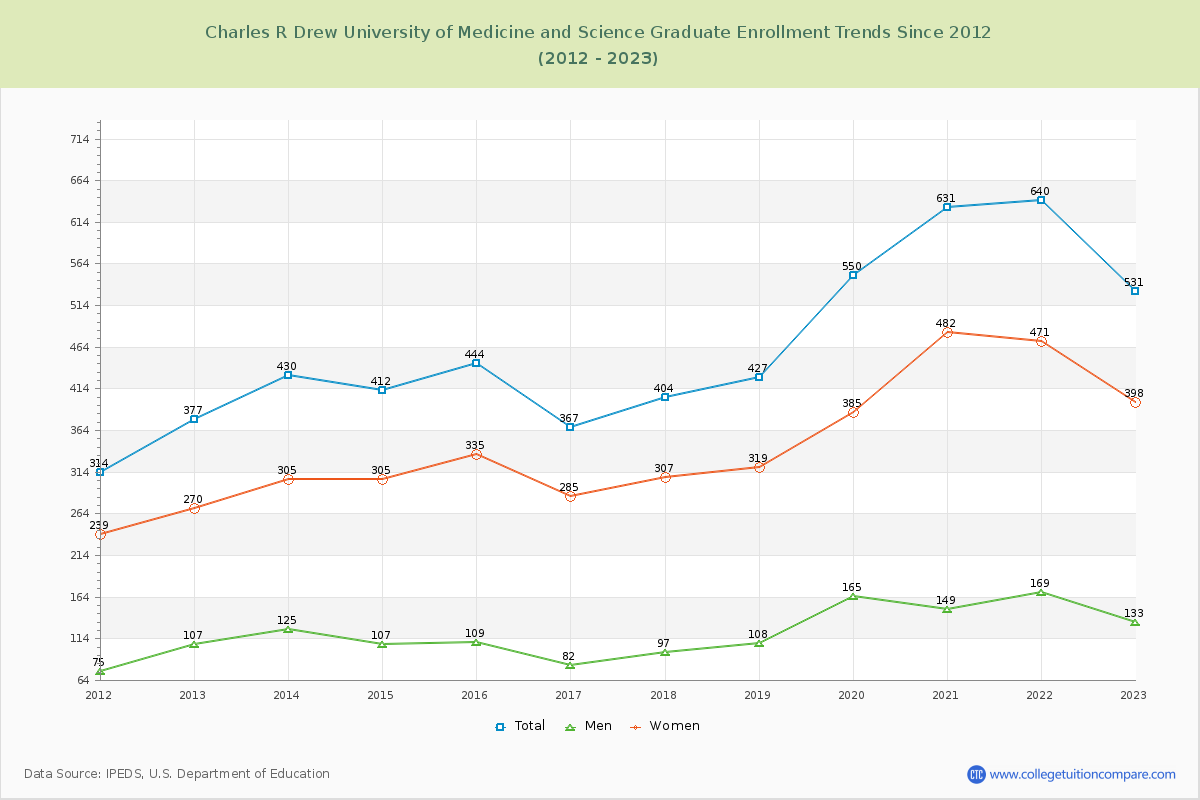
31.66% of total students is undergraduate students and 68.34% students is graduate students. The number of undergraduate students has increased by 138 and the graduate enrollment has increased by 154 over past 10 years.
The female to male ratio is 2.52 to 1 and it means that there are far more female students enrolled in CDU than male students.
The following table and chart illustrate the changes in student population by gender at Charles R Drew University of Medicine and Science since 2012.
| Year | Total | Undergraduate | Graduate | ||||
|---|---|---|---|---|---|---|---|
| Total | Men | Women | Total | Men | Women | ||
| 2012-13 | 485 | 108 | 54 | 54 | 377 | 107 | 270 |
| 2013-14 | 515 30 | 85 -23 | 42 -12 | 43 -11 | 430 53 | 125 18 | 305 35 |
| 2014-15 | 481 -34 | 69 -16 | 37 -5 | 32 -11 | 412 -18 | 107 -18 | 305 0 |
| 2015-16 | 533 52 | 89 20 | 48 11 | 41 9 | 444 32 | 109 2 | 335 30 |
| 2016-17 | 459 -74 | 92 3 | 40 -8 | 52 11 | 367 -77 | 82 -27 | 285 -50 |
| 2017-18 | 543 84 | 139 47 | 58 18 | 81 29 | 404 37 | 97 15 | 307 22 |
| 2018-19 | 596 53 | 169 30 | 57 -1 | 112 31 | 427 23 | 108 11 | 319 12 |
| 2019-20 | 748 152 | 198 29 | 65 8 | 133 21 | 550 123 | 165 57 | 385 66 |
| 2020-21 | 872 124 | 241 43 | 77 12 | 164 31 | 631 81 | 149 -16 | 482 97 |
| 2021-22 | 895 23 | 255 14 | 87 10 | 168 4 | 640 9 | 169 20 | 471 -11 |
| 2022-23 | 777 -118 | 246 -9 | 88 1 | 158 -10 | 531 -109 | 133 -36 | 398 -73 |
| Average | 628 | 154 | 59 | 94 | 474 | 123 | 351 |